![]() Top
Top
![]() Summary
Summary
![]() Introduction
Introduction
![]() Methods and Materials
Methods and Materials
![]() Results
Results
![]() Discussion
Discussion
![]() References/Acknowldgements
References/Acknowldgements
file: elec-osp.821 [rev. 11-20--92]
|
|
|---|
Theodore H. Bullock, Sacit Karamürsel1 and Michael H. Hofmann2
Neurobiology Unit, Scripps Institution of Oceanography and
Department of Neurosciences, University of California, San Diego
La Jolla, California 92093-0201
1 Department of Physiology, Istanbul Medical Faculty, Istanbul, Turkey
2 Department of Anatomy, University of Göttingen, Germany
Running title: Event-related potentials to omitted stimuli in elasmobranchs
Send proofs to: Theodore H. Bullock
Dept. of Neurosciences 0201
University of California, San Diego
9500 Gilman Dr.
La Jolla, CA 92093-0201
FAX: 619-534-3919
Abbreviations: DN, dorsal nucleus of medullary lateral line lobe; EEG, electroencephalogram; EP, evoked potential; ERP, event related potential; IR, induced rhythm; ISI, interstimulus interval; OSP, omitted stimulus potential; MLN, mesencephalic lateral nucleus; P75, positive peak at 75 ms.
|
|
Summary |
|
|
|---|
Multiunit activity and slow local field potentials show Omitted Stimulus Potentials (OSP) in the electrosensory system in rays after a missing stimulus in a 3 to >20 Hz train of microvolt pulses in the bath, at levels from the primary medullary nucleus to the telencephalon. A precursor can be seen in the afferent nerve. The OSP follows the due-time of the first omitted stimulus with a, usually, constant main peak latency, 30-50 ms in medullary dorsal nucleus, 60-100 ms in midbrain, 120-190 ms in telencephalon - as though the brain has an expectation specific to the interstimulus interval (ISI). The latency, form and components vary between nerve, medulla, midbrain and forebrain. They include early fast waves, later slow waves and labile induced rhythms. Responsive loci are quite local. Besides ISI, which exerts a strong influence, many factors affect the OSP slightly, including train parameters and intensity, duration and polarity of the single stimulus pulses. Jitter of ISI does not reduce the OSP substantially, if the last interval equals the mean; the mean and the last interval have the main effect on both amplitude and latency.
Taken together with our recent findings on visually evoked OSPs, we conclude that OSPs do not require higher brain levels or even the complexities of the retina. They appear in primary sensory nuclei and are then modified at midbrain and telencephalic levels. We propose that the initial processes are partly in the receptors and partly in the first central relay including a rapid increase of some depressing influence contributed by each stimulus. This influence comes to an ISI-specific equilibrium with the excitatory influence; withholding a stimulus and hence its depressing influence causes a rebound excitation with a specific latency.
Key words: Evoked potentials; Event related potentials; Omitted stimulus; Electroreception; Thornback ray; Stingray
|
|
Introduction |
|
|
|---|
"It will make a great difference to our understanding if we learn which aspects of the variety of central physiological mechanisms ... related to anticipated and unanticipated sensory input are general ... in lower and higher vertebrates... The nervous system shows preparedness for expected input in a variety of ways... ." (Bullock 1988)
Expectation is a major function of the nervous system. The term is used here to mean a state inferred from behavioral or physiological signs that a certain sensory input is anticipated, though not necessarily consciously. The system is prepared either to respond or not to respond to that input, within some more or less specific time frame, differently from its response when not in this state. As in associative learning, habituation, imprinting and reafference to voluntary commands, the system acts as though it expected the sensory input.
Among the forms of cognitive event related potentials (ERPs), one is the omitted stimulus potential (OSP), discovered in human scalp recording, as a small and labile wave of positivity about 300 ms after the moment a missing stimulus was due, in an ongoing series of regular stimuli at ca. 0.3-1 Hz (Rusinov 1960; Barlow et al. 1965; Sutton et al. 1965, 1967; Klinke et al. 1968; Picton et al. 1974; Renault and Lesevre 1977; Squires et al. 1977; Courchesne 1979; Hillyard and Picton 1979; Ritter et al. 1979; Ruchkin and Sutton 1979a, b; McCallum 1980; Ford and Hillyard 1981; Takasaka 1985). Among nonhuman mammals, quite similar ERPs time-locked to the due-time of an omitted stimulus have been reported from intracranial electrodes in several cortical and subcortical sites in the cat (Baar-Eroglu et al. 1991). In a previous paper we addressed the question whether an ERP to an omitted stimulus occurs in lower vertebrates (Bullock et al. 1990). Large omitted stimulus potentials (OSPs) to missing or delayed flashes in a train of visual stimuli were found in elasmobranchs - in the forebrain and midbrain and even in the retina. In view of the ISI-specific latency or apparent expectation, this last finding was surprising and compelled the question whether the several layers of processing in the retina might account for it.
The present paper asks the question whether such OSPs occur in another sensory modality, entering the medulla in a sensory column nucleus and lacking the complexity of the retina, and if so, whether they arise early or late in the sensory pathway. It will be shown that the electrosensory system - a derivative of the ancient mechanoreceptive lateral line system - has OSPs and that they arise early, already in the periphery. A preliminary report has appeared (Bullock and Hofmann 1991).
|
|
Materials and Methods |
|
|
|---|
Rays (Platyrhinoidis triseriata, the thornback and Urolophus halleri, the stingray) were prepared as described in Bullock et al. (1990), under guidelines established by the University of California, San Diego and the National Institutes of Health. The brain was exposed under MS222, after which the anesthesia passed off and the ray was maintained under partial muscle block with pancuronium bromide (Pavulon, 0.1 mg/kg, intramuscular) in a head holder that allowed movements of fins and tail to be observed. Gill and spiracle movements showed that the block was only partial. Even without Pavulon the rays lie quietly, and respiration and heart rate are normal. Water temperature was maintained close to 15 C. The gills were perfused with aerated sea water, monitored for satisfactory perfusion by adding methylene blue to the incoming stream from time to time. Brain circulation was monitored by observing blood flow in the superficial vessels. Stability of the evoked potentials also monitored the condition of the preparation, in addition to small movements of the fin margins and the spiracles.
Glass microcapillary or tungsten needle electrodes were inserted within the tissue in four levels of the electrosensory system: (i) The anterior lateral line nerve (ALLN), intracranially, ca. 4 mm from the anterior lateral line lobe of the medulla is a nerve which largely consists of axons from ampullary electroreceptors. (ii) The dorsal nucleus (DN) of the lateral line lobe of the medulla is an exclusively electrosensory nucleus. (iii) The mesencephalic lateral nucleus (MLN) is equivalent to the torus semicircularis of the midbrain of other fishes and is electrosensory as well as mechanosensory. (iv) The telencephalic pallium (TEL) in the middle fifth of the cerebrum, anteroposteriorly, ca. 1 mm laterally and 2 mm deep is an area in our species equivalent to the area of the medial pallium from which electrosensory evoked potentials (EP) and multiunit activity were recorded in Raja by Bodznick and Northcutt (1984).
Stimuli were weak pulses of current injected via long carbon electrodes along the wall at each end of the bath, supplied from a constant current device. These roughly uniform fields were longitudinal to the ray, normally head positive, and 10 ms in duration. The intensity was measured as voltage gradient, by a pair of electrodes placed in the middle of the bath; it ranged from 5-200 µV/cm. Stray DC fields were uncontrolled but the receptors are known to be insensitive to DC (Kalmijn 1974; Zakon 1986). The stimulus artifact could be reduced at one of the brain loci by trial and error movement of the recording reference electrode in the bath, but could not be fully avoided at all loci at the same time, hence some figures show artifacts. The principal parameters varied were repetition rate (frequency or interstimulus interval, ISI) and polarity of the single pulses, train duration and rest period between trains. Intensity and duration of the pulses were also varied but had little effect on the OSP. Because the OSP is long lasting, instead of omitting single stimuli, we usually omitted a series of stimuli; that is, we stopped the conditioning train for a period called the rest period, before starting another train. In these cases, the OSPs can also be called train-OFF responses.
Wideband (1-500 Hz) amplified signals were either recorded on a computer or on an FM tape recorder for later playback into a pen-writing chart recorder. Single sweeps or averages of up to 20 sweeps are displayed, usually around the last stimulus of a long conditioning train, which was generally 10 s in duration. The term conditioning means that it influences the state of the preparation, without any implication of positive or negative reinforcement.
Electrode loci of interest, especially in the telencephalon, were marked by electrolytic lesions, after which the ray was maintained for some hours, then the brain was fixed for histological examination.
|
|
Results |
|
|
|---|
A. Electrosensory evoked potentials to a train of adequate stimuli
1. Anterior lateral line nerve Whole nerve recordings from the electrosensory dorsal root of this lateral line nerve show, as is well known, a moderately high level of spontaneous firing of the many ampullae of Lorenzini. Pulses of current in the bath (e.g. 10-50 ms) cause a burst of firing or a silencing of the background activity or both in succession, due to rebound, according to the polarity, intensity and duration. Important for the steady state response with trains of stimuli is the strong postexcitatory inhibition that follows an initial, brief excitation and the longer lasting initial inhibition when the stimulus has the opposite polarity. Moderate intensity over a wide range causes these periods of inhibition to last almost as long as the ISI. The duration of the silent period varies systematically with the ISI but not quite perfectly in parallel. In the range 2-3.3 Hz it lasts for a longer time at the lower stimulus rates, though < ISI. At 4 Hz and above the silencing lasts longer than the ISI so that a train maintains an inhibited state, with or without a short, early burst, depending on the polarity and intensity. After the last stimulus of a train the inhibited state lasts for some time and becomes the background out of which the OSP rises (see next section).
Although previous authors have studied the responses in ampullary nerves (the most relevant to this paper are: Murray 1965a, b, 1967, 1974; Broun et al. 1972; Obara and Bennett 1972; Akoev and Adrianov 1989; Akoev et al. 1976a, b; Bromm et al. 1976; Broun and Ilyinski 1984; Montgomery 1984) some dynamic properties are not familiar since most of the brief pulse stimuli have been delivered by these authors at <2 Hz. Rate effects can be more or less pronounced, such that the maximum response, a synchronized burst in a number of fibers, is not always at the lowest repetition rate; it can be at ca. 4 Hz (Figs. 1, 4). Frequency following extends up to frequencies well above 10 Hz in averaged records. Late components of the nerve response have generally been overlooked; they vary in latency with intensity and frequency of the stimulus. In one preparation, at 2 Hz and 120 V/cm (strong but not saturating or over-stimulating in Murray's 1965b terminology) a small compound wave appeared in the nerve with positive and negative peaks ca. 335 and 350 ms after the ON of a 50 ms pulse; at 3.3 Hz it was much larger and three-peaked, the first and last being at 265 and 280 ms; at 4 Hz the first of multiple peaks was ca. 235 ms after ON. Above 5 Hz, where the expected latency is longer than the ISI, no response appears, that is, some early inhibition is caused by each stimulus that prevents what would happen without that stimulus. However, in Fig. 4C one can see good following at 10 Hz in some sweeps (trains), changing to no following in subsequent sweeps; this is recorded in the medullary nucleus but it means that the nerve must have been able to follow.
Slow waves in the whole nerve recording resemble those of the central nervous system (Figs. 3, 4); one has to control that they are not due to electrotonic conduction from the medulla. We find that they are often incongruent in form and latency, and in change over repetition and that the medullary EPs fall to undetectable values within one or two millimeters, much less than the distance between our anterior lateral line nerve electrodes and the active locus in the medulla. As examples, the first sharp peak in the nerve in Figure 4A at 3.3 Hz precedes that in the medulla by at least 7 ms; the second peak is larger in the medulla but tiny in the nerve.
2. Dorsal nucleus of the lateral line lobe of the medulla Previous authors have described the main peaks and latencies of the EP of the medullary electrosensory nucleus in elasmobranchs (Platt et al. 1974, Bullock 1979; Bodznick and Northcutt 1980; Bullock et al. 1983; Broun and Ilyinsky 1984; Andrianov et al. 1985; New and Bodznick 1985; Schweitzer 1986a, b; Fields et al. 1992), although rather less is known about the medullary than about the mesencephalic electrosensory center and little is known about the dynamics of response to iterative stimuli.
The rate effect is known, i.e. the decrease in EP amplitude with increase in stimulus repetition rate, but the time it requires to reach equilibrium and the disproportionate decrease in certain components are not familiar. Figure 1 shows a preparation and stimulus that gives EPs which vary from very small, at 2 Hz, to modest at 6.7 Hz and maximum at 4 Hz. Thus, there is some facilitation in the steady state or frequency following response (FFR). For the purposes of the present study we do not go into the parametric dependency of these properties upon intensity, duration, polarity and shape of the electric field or the part of the nucleus, descending influences and other determinants.
Fig. 1 Effect of frequency. Ends of 10 s trains of 60 ms pulses. Triangles = due-time of first omitted stimulus. Upper: nerve = anterior lateral line nerve. Lower: medulla = electrosensory dorsal nucleus. Note rebound burst in nerve and OSP in medulla arise on schedule, just after due-time. Note 55 Hz oscillation in some OSPs. Single sweeps; Platyrhinoidis. Calibration: 50 V for nerve; 250 V for medulla. |
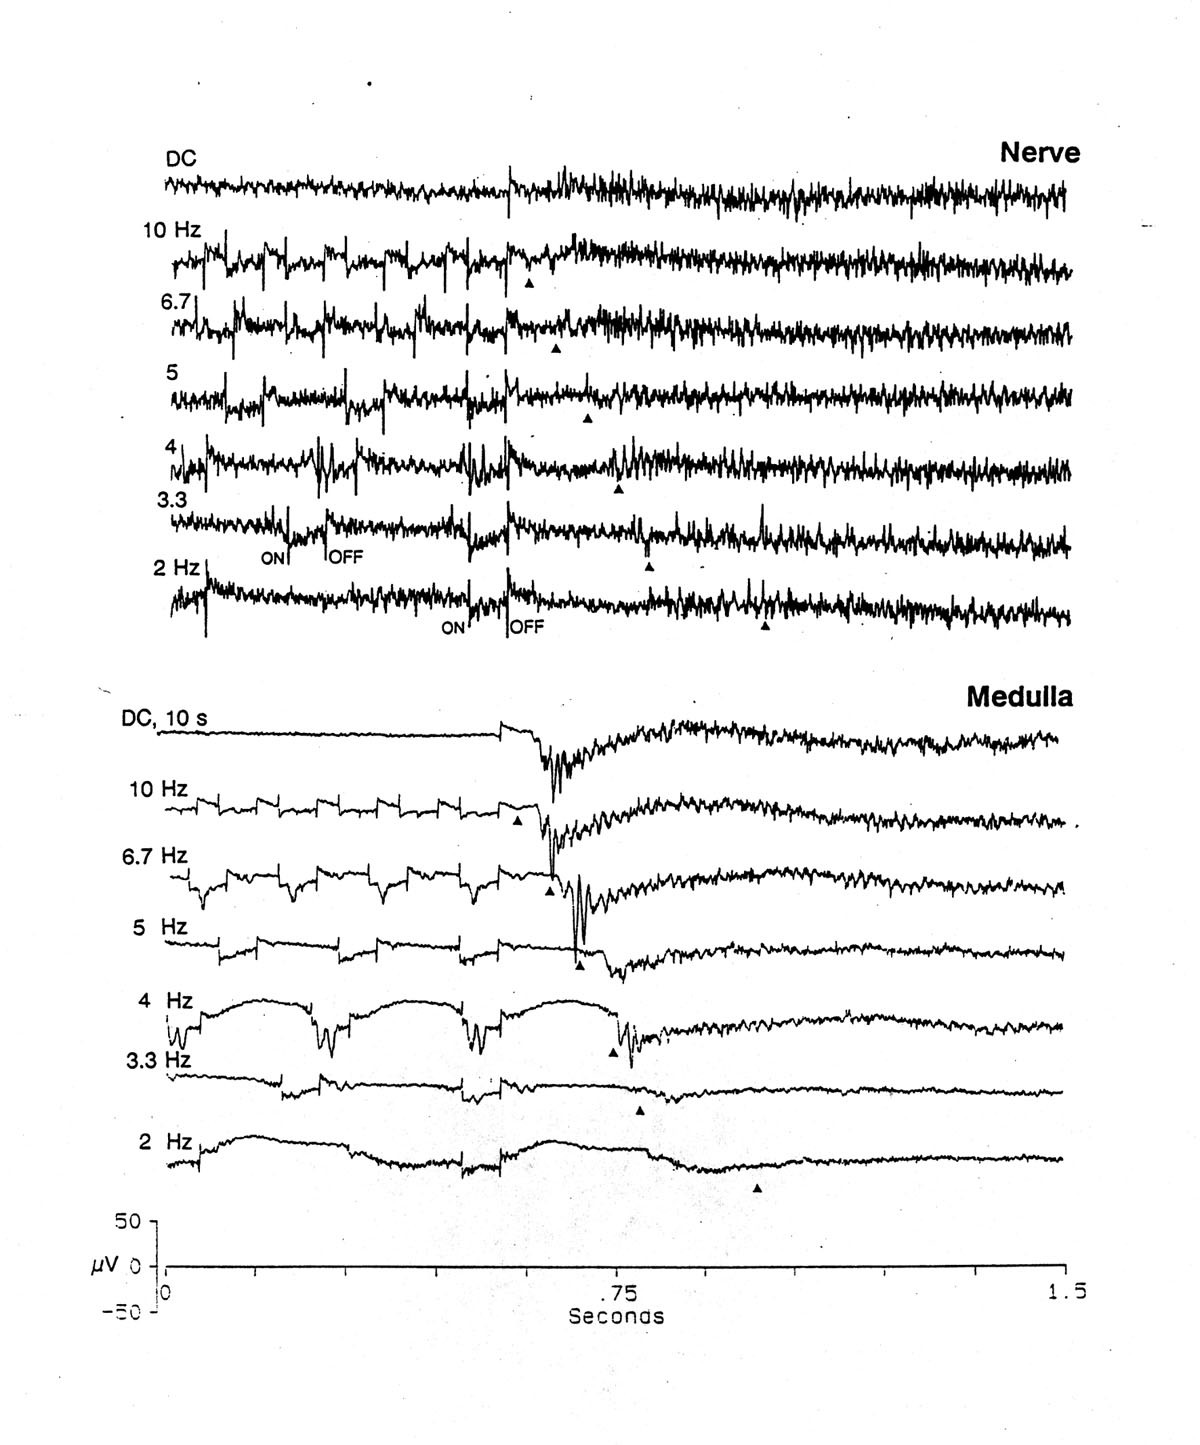 |
A feature that is germane to the present scope is seen in Figure 2A where the evoked potential to a single stimulus event is shown for each of four trials and the average of 20 trials. The stimulus is not a brief pulse but the OFF of a long direct current. Besides the familiar early, brief peaks (N50 and N170), imperfectly regular induced rhythms (IR) of ca. 12-14 Hz are triggered and sustained for >1.5 s. Such oscillations are quite labile, often missing or short-lived, but relatively fixed in frequency. Commonly they are not well time-locked to the stimulus and therefore tend to disappear in averages, as here. The relevance to our study will be seen when we compare this OFF response to a DC stimulus with that to omitted stimuli after a conditioning train of pulses, in the next section.
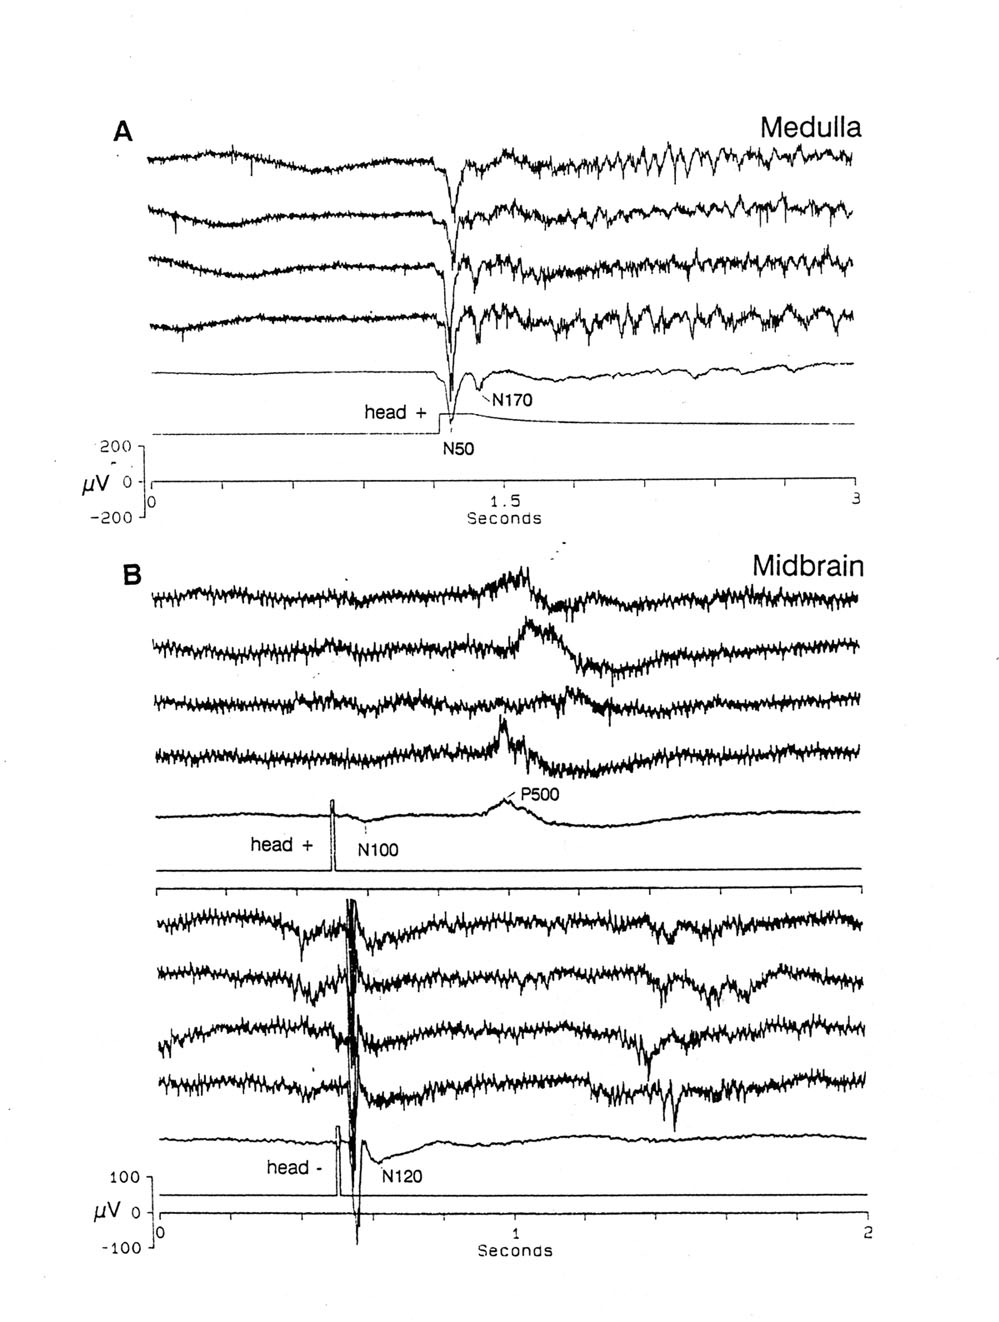
3. Mesencephalic lateral nucleus Figure 2B shows EPs to single, fairly strong but submaximal, very brief (10 ms) pulses, recorded in the midbrain electrosensory nucleus lateral and ventral to the tectum, four single sweeps above and the average of 20 below, in each of the two polarities of a longitudinal, uniform field. The slow time scale collapses the well known midbrain EPs (Platt et al. 1974; Bullock 1979; Broun and Ilyinsky 1984; Andrianov et al. 1985; Schweitzer 1986a, b; Fields et al. 1992) whose main peak is here N55 with the head negative stimulus. The head positive stimulus in this electrode locus gives almost no early EP but a large, late P500 is quite variable in latency and fatigues or disappears easily.
4. Deep, central telencephalon From a very restricted part of the telencephalon EPs can be found to electric stimuli (Platt et al. 1974; Bullock 1979; Bodznick and Northcutt 1984; Bullock and Hofmann 1991), if they are given at low frequency. More variable and labile than the EPs at lower levels, a typical main peak latency is 75 ms; it can be negative or positive, depending on the position of the electrode. Decrement in amplitude with repetition rate is severe above one stimulus every few seconds. The form of the EP is a slow, rounded hump, not multiple or sharp peaks.
Fig. 2 Responses to single stimuli. A. Medullary dorsal nucleus. OFF of a 10 s long steady current, 65 µV/cm, positive rostrally. Note the large N50 and smaller N170 EP followed by variable slow oscillations, from 7-20 Hz. The ongoing spikey background is relatively suppressed during the current and released after the OFF. B. Midbrain MLN. Effect of polarity of a brief pulse electric field. Stimulus: 10 ms, 130 µV/cm pulse, above: positive rostrally - the less effective polarity; below: negative rostrally. Note, above, the minimal early N100 EP plus a large late P500 wave; below, the large, early N55 EP and smaller very late waves (ca. 1 s). Single sweep records of 4 consecutive trials and the average of 20. Platyrhinoidis |
 |
B. End-of-train responses: omitted stimulus potential (OSP)
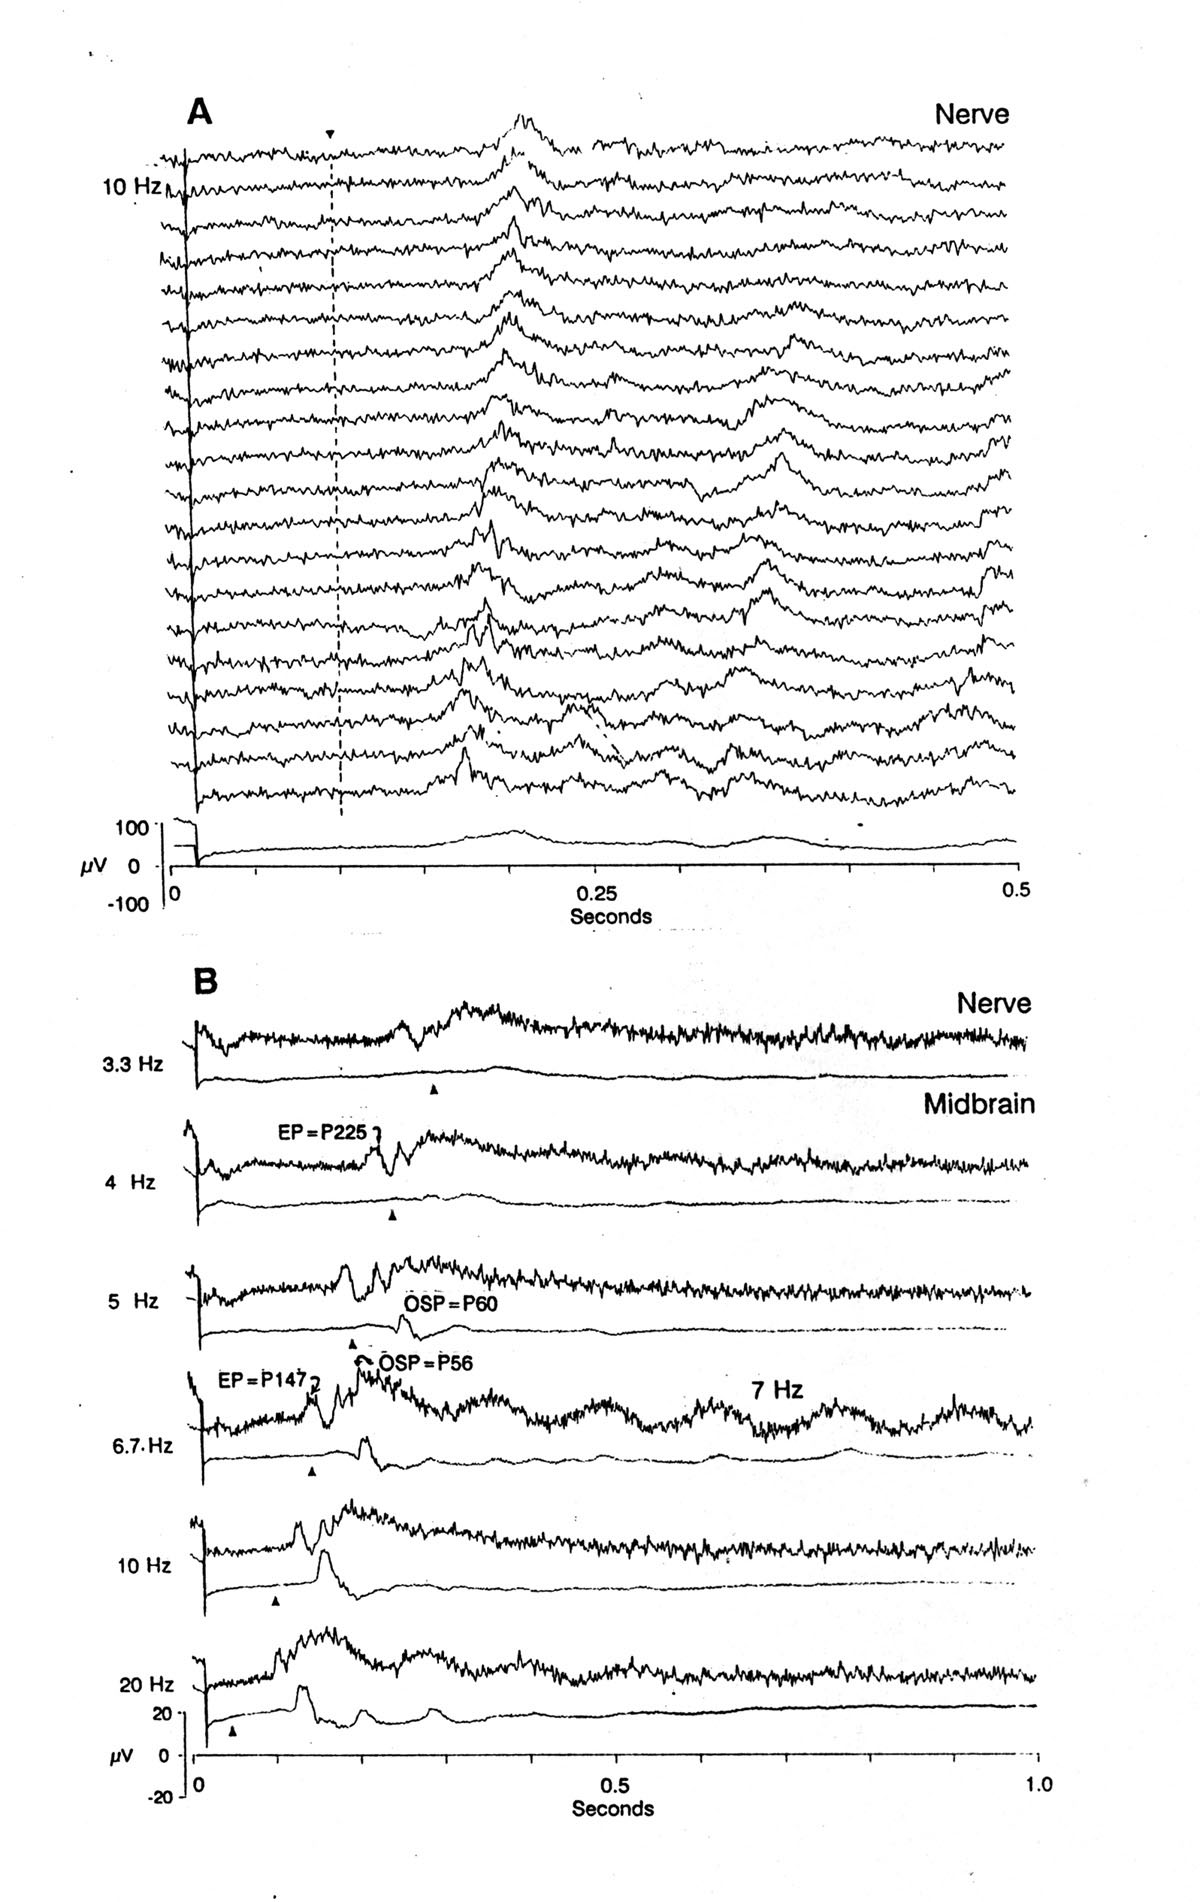
1. Anterior lateral line nerve Figures 1, 3 and 4 show that already in the peripheral nerve a special form of activity appears after the due-time of the first omitted stimulus. In the single sweeps of Figure 1 it takes the form of a postinhibitory rebound of sustained high spontaneous firing of many units. At the lowest stimulus frequency, 2 Hz, the rebound begins well before the due-time and can therefore be described as a late response to the last stimulus, with the remarkable feature that the latency is systematically shorter after higher frequencies. At 3.3 and 4 Hz it is almost exactly equal to the ISI, and at 5, 6.7 and 10 Hz it is just slightly longer. The single sweeps of Figure 3A, representing the ends of successive trains at 10 Hz, show a slow wave well after the due-time, with a peak latency that decreases from 125 ms to 75 ms in 20 repetitions. The later trials also show an induced rhythm at ca. 20 Hz. Figure 3B shows the effect of frequency of the conditioning pulses; the earliest slow wave precedes the due-time at low frequencies and is therefore simply a late EP of the last stimulus, with the remarkable feature already noted above that the latency depends on the stimulus frequency. The later waves, marked OSP are not present in the responses to the previous stimuli (not shown in the figure) and, while also evoked by the last stimulus, must be permitted by the absence of a stimulus, i.e. attributed to disinhibition. Figure 4A shows both the rebound firing and the slow wave as well as an induced rhythm at ca. 7.6 Hz.
2. Dorsal nucleus of the medulla Figures 1, 4, 5 and 6C show that something new appears after the due-time of the first omitted stimulus, above a threshold frequency: ca. 3 Hz. It increases in prominence with frequency of the conditioning train, to a maximum at ca. 20 Hz (not shown). We define as the OSP whatever deflections are new, i.e. cannot be seen in or predicted from the EPs to the preceding stimuli. The OSP in the medullary center consists of a burst of spikes or 5-10 ms sharp waves on a slow negative wave or an early, main, sharp negative wave with a slower decline of 300-500 ms and an induced rhythm of high frequency riding on it - 44 Hz in Figure 4B. Sometimes this is followed by a one to two second induced rhythm of low frequency (5-7 Hz, top of Figure 4B). This slow rhythm is quite labile; it comes and goes in successive trials. The first, main peak latency is approximately constant over a wide range of train ISIs; the mean latency in Figures 1 and 4B is ca. 40 ms, in Figure 4A 60-70 ms, in Figure 5 55-65 ms. In some electrode loci the medullary latency is less than that in some nerve records but in others, where presumably the ALLN electrode is in a "better" locus, the nerve response precedes the medullary.
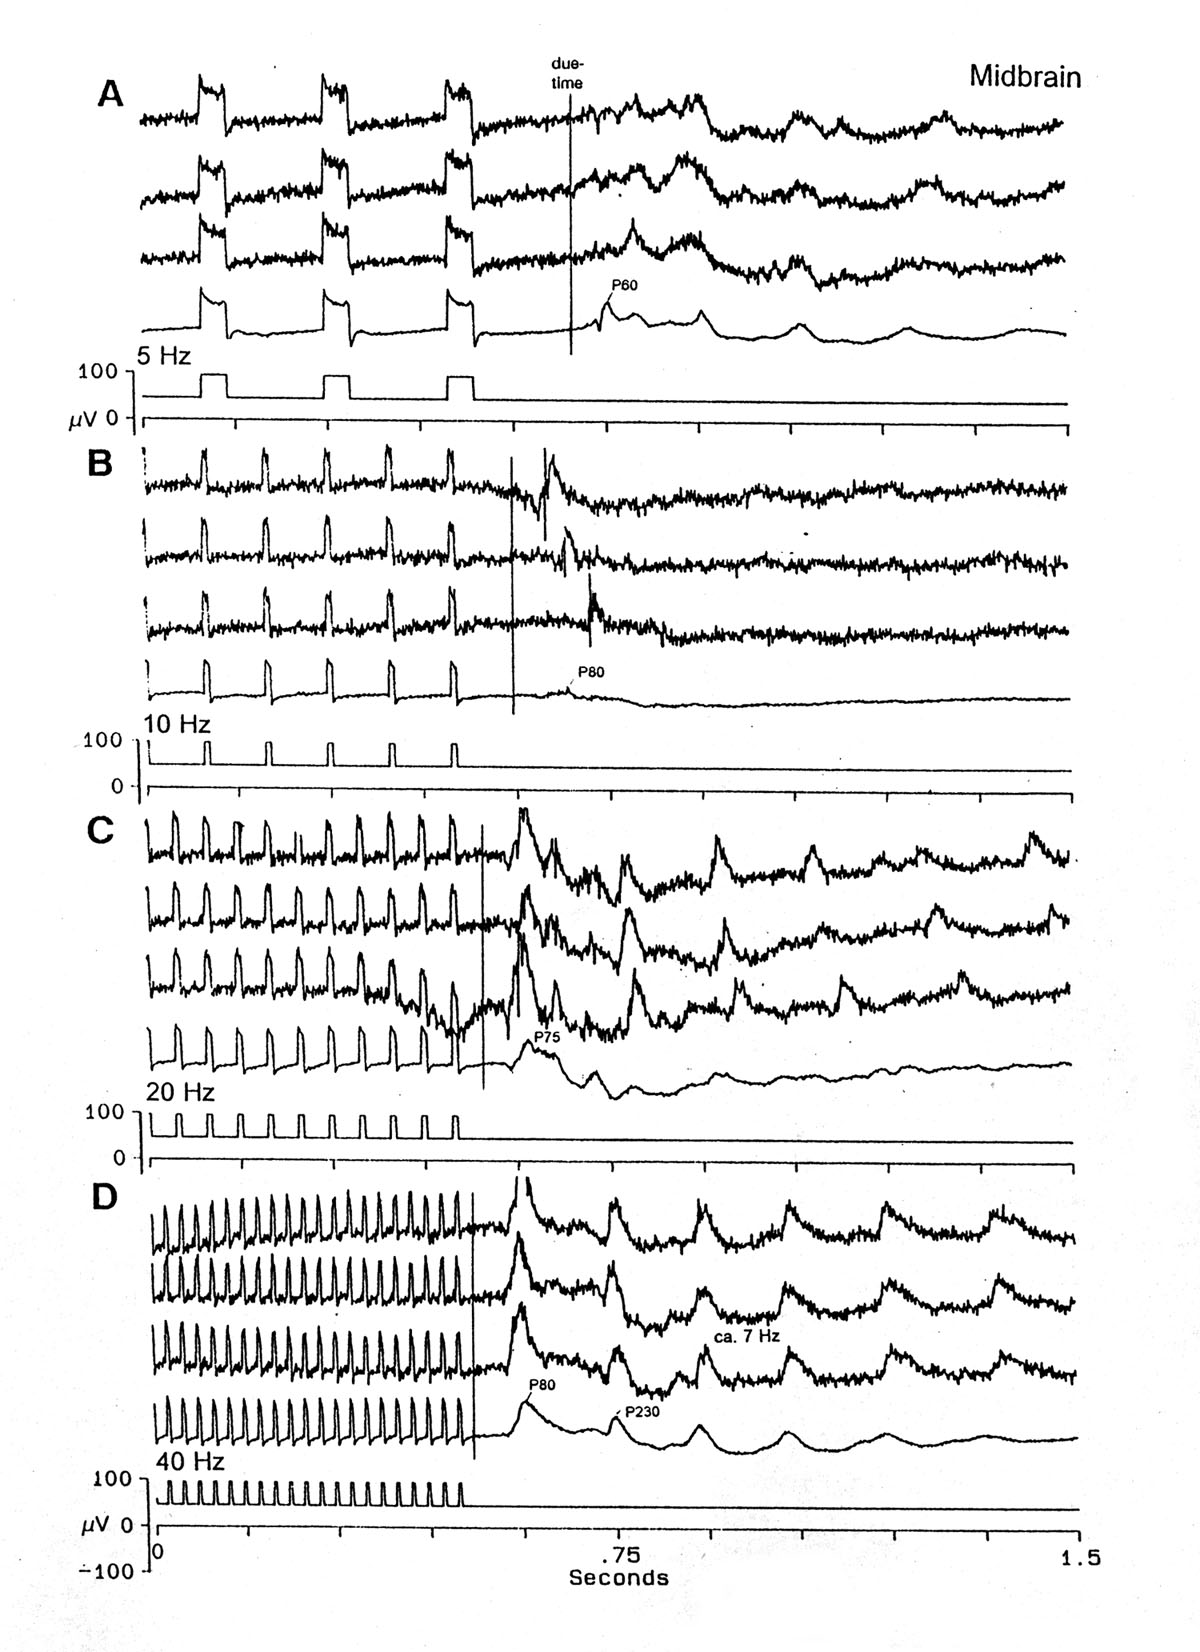
3. Mesencephalic lateral nucleus Figures 3B, 4A, 5, 6A and 7 show a prominent OSP in the midbrain, all the more conspicuous because here the EPs after each stimulus fail to follow above some frequency, often <10 Hz (Fig. 4A, 10 Hz) or even 5 Hz (Figs. 5, 7). The form is typically a large, main positive wave at 60-90 ms after the due-time, often preceded and followed by small negative peaks and commonly followed by a >500 ms induced rhythm of ca. 5-7 Hz. The latency sometimes shifts substantially in successive trials, so that averages are seriously smeared (Fig. 7B).
4. Deep central telencephalon Figure 6B shows that a prominent OSP appears in the telencephalon if the electrode is in the right locus. Longer in latency than the midbrain, the main forebrain peak is positive at 190 ms, preceded and followed by small negative peaks. As Figure 6C shows, the main peak may be negative and our present opinion is that this depends on depth; in most of our good penetrations we do not have a satisfactory series with which to make a depth profile. Induced rhythms are generally not seen. As a rule, no evoked potentials survive above 2 Hz, perhaps even lower.
Fig. 3 A. Effect of repetition of train upon whole nerve response. Ends of 10 s trains of 20 ms pulses at 10 Hz; 2s rest after each train. Last stimulus of train is at start of each sweep. Single sweeps of the 1st to the 20th train, followed by average of all 20. Triangle and dashed line = due-time of first omitted stimulus. Note the shorter latency of the OFF effect in later trials and the smearing in the average. Electrosensory anterior lateral line nerve. B. Off effects at the ends of 10 s trains of stimuli at different frequencies, recording in the same nerve and in the mesencephalic lateral nucleus. Stimuli 20 ms, 120 V/cm head +. Sweep starts with the last stimulus of each train; triangles = due-time of first omitted stimulus. Deflections preceding triangles have to be called EPs; those following the due-time are not seen after the previous stimuli (not shown) and are therefore caused or permitted by the absence of a stimulus and are called OSPs, being EPs of the last stimulus uninhibited by the missing stimulus. The EP in the nerve at P225 (4 Hz), advancing to the shorter latency of P147 at 6.7 Hz becomes an OSP at 10 Hz, since it is not seen during the train. We cannot exclude the possibility that this wave came from the medullary dorsal nucleus by electrotonic spread; such a late EP is not usually seen in either place but underlines the fact that late waves can occur, probably as a function of brain state. Note in some sweeps an IR oscillation of ca. 7 Hz. Averages of 20 sweeps; calibration 20 V for nerve traces; 100 V for midbrain. Platyrhinoidis |
 |
C. Effect of stimulus parameters on the OSP
1. Frequency (reciprocal of ISI) Figures 1, 3B, 6 and 7 show that the dynamic range from no OSP to the maximum OSP is ca. 3-20 Hz. There is little or no systematic effect on the latency of the main peak from the due-time of the first omitted stimulus. Principally the only effect is on the amplitude - larger and longer OSP responses after higher frequencies, and on the duration of the IR, both fast and slow in the medulla and midbrain. Since there is little evidence of following above 15 Hz, and yet the OSP is prevented by 20 Hz or 40 Hz or higher, until the train is interrupted or stops, it is not surprising that DC stimulation is followed, after the OFF, by a response that looks just like an OSP. This requires a current of sufficient duration, for example 500 ms for a certain, moderate intensity and field orientation.
2. Duration of, or number of stimuli in the conditioning train There is rather little influence of this parameter. Ten second trains are likely to cause slightly larger OSPs than 2 s trains. Fewer than 10 conditioning stimuli suffice to cause a clear OSP at 10 Hz, even fewer at 20 Hz.
3. Duration and intensity of uniform field electric pulses These parameters influence the EP, although nonlinearly, but have only a weak effect on the OSP, as shown in Figure 7. Pulses can be as short as 10 ms but are inefficient or require high voltage if shorter than ca. 3 ms.
4. Polarity and orientation of electric field In most recording loci one polarity of the uniform, longitudinal field we used was more effective in evoking responses, both EPs and OSPs, than the other polarity. From previous work on the receptors and central EPs we expect that a certain field orientation will be the best for each recording locus; we did not systematically study this parameter in the present experiments, since intensity or effectiveness had only a weak influence on the OSP.
5. Jitter of ISI; effect of last interval and of preceding intervals Since the tendency to show a constant latency over a wide range of frequencies indicates a mechanism equivalent to a temporally specific expectation, the question becomes germane whether this specific expectation can be reduced by making the next due-time less certain. The ISI was jittered by a pseudo-random sequence of equal probability of values between chosen extremes with the same mean as a regular sequence of uniform ISIs. A long mean ISI, 150 ms, was selected to give a large range between shortest and longest ISIs in the jittered series; jitter between 100 and 200 ms was called "low jitter" and 50-250 ms "high jitter." The OSP was found to depend strongly upon the value of the last interval. Therefore the pseudorandom series was specified to end always with an interval equal to the mean. The OSP was then only slightly different in amplitude, comparing the regular, low and high jitter trains. Sometimes the latency was longer after a jitter series, but we did not extend the study to discover what rules might underlie latency fluctuation.
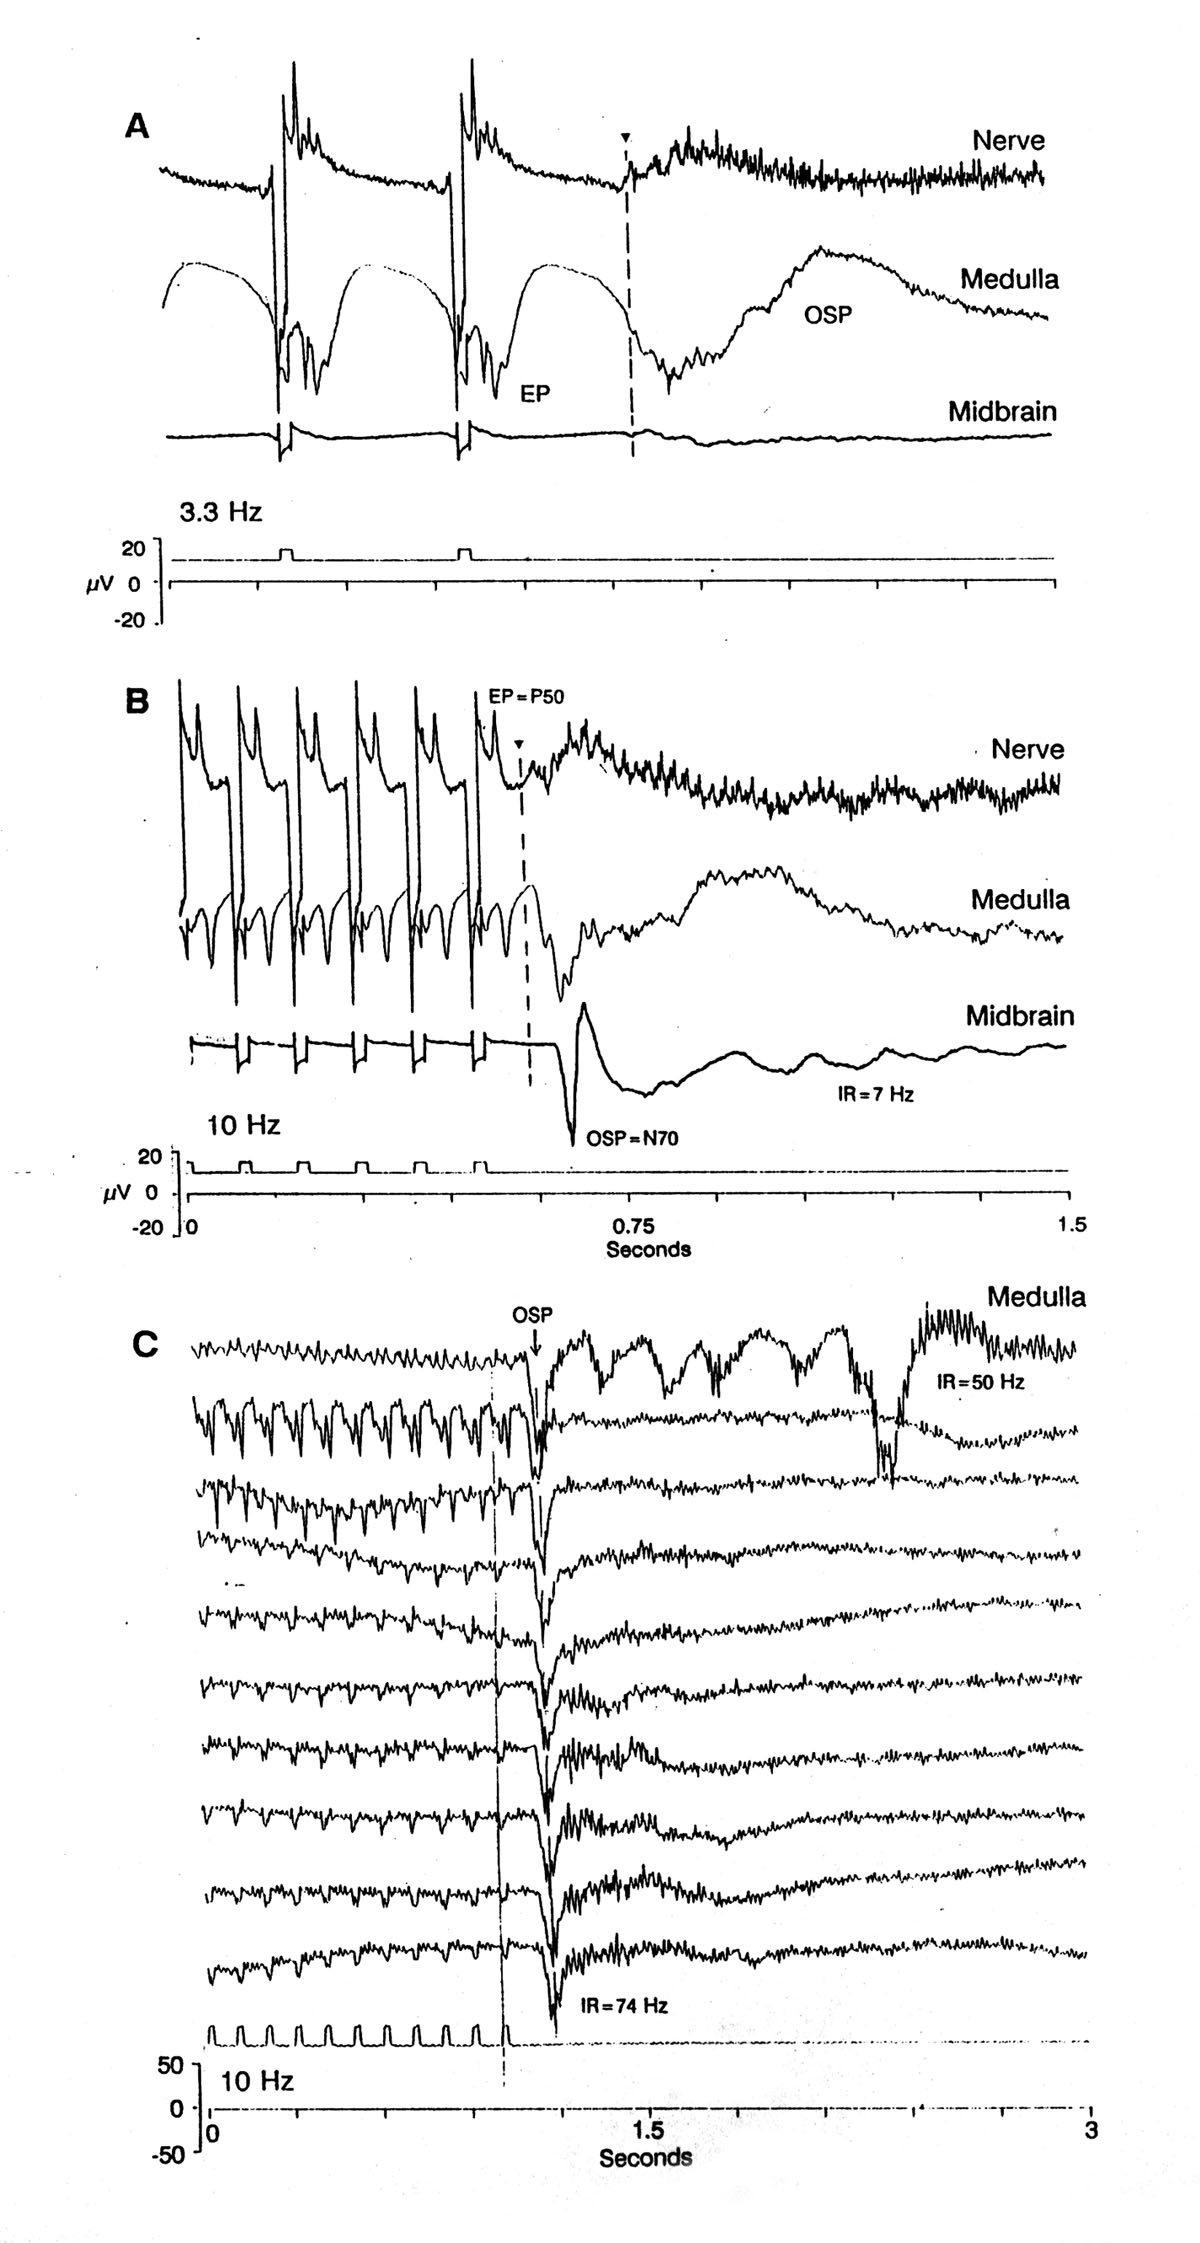
Fig. 4 A. Nerve, medulla (as Fig. 3) and midbrain = mesencephalic lateral line nucleus. End of train of pulses at 3.3 Hz. B. Same at 10 Hz. Triangles and dashed lines = due-time of first omitted stimulus. Note the nerve resumes its high background spontaneous activity just after the due-time (sometimes just before, in other experiments) - as a post-inhibitory rebound; also a slow wave underlies the MUA and, after 10 Hz, some slow induced oscillatory waves. In the medulla the OSP waves have different peak times from those in the nerve. The midbrain has OSP waves of small amplitude at 3.3 Hz but a large N70 at 10 Hz and some 7 Hz IR waves. Platyrhinoidis; averages of 20; calibration is 20 µV for the nerve; 200 µV for medulla and midbrain. C. Dorsal nucleus of medulla; variability of induced oscillations. Stimulus: 10 s train of 10 Hz, 20 ms, 65 µV/cm pulses; end of the first 10 trains shown. Note the variability of evoked potentials in successive trains, the slow (4-6 Hz) oscillations after the last stimulus in train 1 only, and the high frequency oscillation immediately after the OSP (ca. 74 Hz) increasing progressively in trains 4 to 10. A tendency to high frequency IR oscillation (ca. 50 Hz) appears also in train 1, especially after the large episodic negative wave. Other evidence in this preparation also pointed to fluctuations in excitability. Platyrhinoidis |
 |
D. Evidence for fluctuations in sensitivity
Some rays have shown episodes of depressed sensitivity lasting for tens of minutes and therefore not attributable to general deterioration. Sometimes this is attributable to a single strong stimulus, e.g. 1 mV/cm. On occasion a single, large, spontaneous deflection appeared in all three channels - nerve, medulla and midbrain, followed by depressed responses for many minutes and then recovery. The fluctuations can not all be attributed to a movement, such as a "cough," and consequent local damage to the brain.
Fig. 5 Growth of OSPs in medullary dorsal nucleus (upper traces, with spikes and evoked potentials after each stimulus artifact) and midbrain MLN (lower traces). Ends of 10 s trains of 5 Hz, 20 ms, 65 µV/cm rostrum-positive pulses; sample single sweeps of trains #9, 12, 15, 18 and 20. Note the progressive increase in the slow wave component of the OSPs and in the duration of the medullary spike bursts with later trains. Platyrhinoidis. x: artifact of stimulus; EP: evoked potential; OS: first omitted stimulus; OSP: omitted stimulus potential. |
 |
E. Interaction with other stimulus modalities
Quite similar OSPs occur in the midbrain and telencephalon after trains of flashes (Bullock et al. 1990). Several tests for interaction by stimulation of both photic and electric modalities, with different intervals between them, have failed to show anything but simple algebraic summation of the responses. No active influence of one system upon the other has been found.
Fig. 6 OSP latency after trains of different ISIs. A. Mesencephalon, lateral nucleus (MLN). Ends of 10 s trains of 10 ms, 120 V/cm head-positive pulses at the frequencies shown, separated by 2 s of rest. Averages of 20, lined up by the last stimulus; the due-time of the first omitted stimulus is marked by a triangle. Note the latency of the first, large, positive OSP peak - P70-75 after the due-time. An oscillation of ca. 5 Hz follows and lasts ca. 1 s; not shown here is its high lability. Platyrhinoidis B. Telencephalon, medial, central, deep. Ends of 2 s trains of 20 ms, 50 V/cm head-negative pulses at the frequencies shown, separated by 2 s of rest. Averages of 32, lined up by the due-time of the first omitted stimulus. Note the fixed latency of the first large positive OSP peak 190 ms after the due-time and the increased size of the OSP at higher conditioning frequencies. No oscillation was observed in the telencephalon. Urolophus 29ma36.avg C. OSP recorded simultaneously in medulla, midbrain and telencephalon. Note the later peak latencies in midbrain and forebrain and the smaller relative size of the 5 Hz IR oscillations. Averages of 19 sweeps; Platyrhinoidis. |
 |
F. Anatomical localization of responsive electrode positions
With apparently minor exceptions, the electrode loci showing the largest OSPs also have large EPs. Previous studies, already cited, have localized the best EPs in each of the brain regions examined here. We can confirm that the responses, in both forms, are best when the medullary electrode is in the position of the dorsal nucleus, and when the midbrain electrode is in the position of the lateral nucleus. Lesions were made in responsive loci in the telencephalon of our species, to compare with the findings of Bodznick and Northcutt (1984) in Raja erinacea. Microscopic preparations of the stingray, Urolophus, were kindly examined by R.G. Northcutt. The common denominator of the lesions was the dorsal pallium; they usually touched the pars superficialis and the pars centralis. One electrode track appeared to enter the dorsal and/or the medial pallium. This localization may be appreciably different from that found in Raja by Bodznick and Northcutt who concluded from the depth and proximity to the lateral ventricle and medial forebrain bundle that the electrosensory area belongs to a subdivision of the medial pallium. It is also notable that the area showing evoked responses to electric stimuli in Raja is described as large, extending throughout the central one third of the skate telencephalon. In Urolophus the responsive area is small in comparison to the much larger telencephalon. We did not systematically test each responsive locus for evoked potentials to photic stimuli and therefore cannot comment on the report of Bodznick and Northcutt that the electric and photic response areas are coincident, though with slightly different positions of maximal response.
Fig. 7 Effects of stimulus parameters upon the late components of the OSP in the midbrain MLN. Instead of showing separately the slight influences of stimulus pulse duration and intensity and frequency, this montage illustrates the very modest effects of a combination of changing frequency and duration, especially on the late, slow induced rhythms. Other figures examine more carefully the effect of frequency alone upon the latency of the first large peak. A. 5 Hz, 40 ms conditioning train pulses. B. 10 Hz, 10 ms pulses. C. 20 Hz, 10 ms pulses. D. 40 Hz, 5 ms pulses. Note almost no effect of this large range of stimuli upon the P60-90 first main OSP peak and the ca. 7 Hz induced rhythm, except for the reduced oscillations in B. Platyrhinoidis |
 |
|
|
Discussion |
|
|
|---|
We can answer in the affirmative the question posed: can sensory modalities without the complexity of the retina (Bullock et al. 1990) show apparent expectation in omitted stimulus potentials already at the brainstem level? The electrosensory modality belongs to the octavo-lateralis system, with a relatively simple first order nucleus in the medulla, comparable to the acoustic and vestibular nuclei, and a pathway extending to the telencephalon (Bodznick and Northcutt 1984). The findings of most general interest, perhaps, are two.
(i) Prominent event related potentials, more or less complex in form, are already in the primary sensory nucleus in the medulla and are further modified and delayed in circumscribed loci in midbrain and forebrain. In other words, this form of ERP does not appear do novo in the forebrain; rather, the novelty of an expectation not being met is already detected very early in the pathway, where it is unlikely to be cognitive in the dictionary sense, and is modified and delayed at higher levels, where it presumably changes in behavioral and perhaps cognitive significance.
(ii) Absent perturbing factors, the OSPs are interval-specific, arising "on schedule," with a fixed latency after the due-time of the omitted stimulus, as though the system were expecting the stimulus on time. In fact, clear evidence of this interval specificity is found in the peripheral nerve, in a suppression of the spontaneous activity for a period varying with and sometimes close to the ISI of the conditioning train (Figs. 1, 3B, 4A), apparently overlooked in previous studies of afferent nerve responses. This suppression, which presumably occurs in the receptor as a kind of hyperpolarizing afterpotential, is the first sign but probably not the only site of the prevention of the OSP waves that each stimulus causes.
As in the visual system of the same elasmobranchs and of turtles (Prechtl and Bullock 1992), the OSP is complex, with an initial, relatively sharp main wave and variable late waves and induced rhythms lasting for hundreds of milliseconds. Because of the long duration, the parameters have been examined primarily after omitting several stimuli, therefore at the end of conditioning trains. As in the visual system, the OSP resembles the OFF response to a single, long DC stimulus. It is quite distinct from the stimulus-locked evoked potential and is largest when the EP is smallest or absent due to a stimulus frequency above the following frequency for that brain level. In the present material the OSP is usually maximal at the same loci where EPs are maximal. As in the visual system, the OSP is little affected by intensity or duration of the conditioning stimuli, moderately influenced by train parameters, duration and rest period, but profoundly dependent on the frequency within the train. We have not systematically studied the influence of brain state but the evidence of unexplained changes in responsivity suggests that state is important.
As in the visual system, jitter around the same mean interval as a regular train causes little if any change in amplitude or latency, providing the last interval is the same, namely the mean ISI. The last one is especially important but we cannot specify precisely the time constant of decline of influence of the last few ISIs. This would seem to be a major difference from a high level cognitive expectation. In agreement with a brief report by Takasaka (1985), our unpublished experiments on humans, done with E. Baar, C. Baar-Eroglu, S. Karamrsel and J.Z. Achimowicz confirm that similar jitter nearly flattens the human scalp-recorded OSP. It must be said, however, that this comparison has so far been made in humans with the advantage of attention and at a mean ISI of 2s, whereas the rays show no OSP below 2 Hz to our meaningless stimuli.
A difference between the findings, so far, in humans and rays is that the same electrode loci are typically good for EPs and OSPs in the latter but the scalp maxima are distinct in humans. It must be underlined that we are not sure we have found the best loci in the rays, since we have rarely seen OSP spikes or multiunit activity in the forebrain. Another difference is that the latency after the omitted stimulus was due is much shorter in the ray: ca. 190 ms at the first large peak in the telencephalon, compared to 400-600 ms in the human, a range in which we agree with earlier workers (cited in the Introduction). Baar-Eroglu et al. (1991) find a peak latency of 300 ms in the cat with intracerebral electrodes in several parts of the cerebrum. Further comparison with laboratory mammals and human scalp-recorded OSPs requires new data on the latter, since the literature is confined to ISIs of ca. 0.7-1.5 s (up to 3 s in the cat), without systematic study of latency at several ISIs or of short ISIs (30-500 ms), in the range effective for OSPs in elasmobranchs or of different degrees of jitter at different mean ISIs. Our preliminary data indicate that human scalp-recorded OSPs in the short ISI range are more like those seen in the rays and have quite different dynamics than those in the literature, using longer ISIs.
New work on humans or laboratory mammals is particularly needed to look for the brainstem antecedents of the cortical events heretofore recorded. In the rays it is clear that events with some properties of apparent expectation begin early and are then delayed and sculpted at midbrain and forebrain levels but we do not know which stages are subject to effects of brain state, such as attention.
The OSPs would appear to offer a new source of material upon which to study the phenomena of induced rhythms, long known but recently emerging into prominence with new examples and attention (Baar and Bullock 1992). The present examples are notable for being maximal in amplitude in the medulla or midbrain and declining drastically in the forebrain. In the forebrain of a reptile, recently studied in this laboratory (Prechtl and Bullock 1992), the induced rhythm in the OSP does not decline but is prominent, as it is in the long ISI single flash VEP. The induced rhythms in rays are notable for two features: (i) the three distinct ranges of frequencies (5-7, 15-25 and 40-65 Hz), each labile and facultative, and (ii) the time-locked character usually seen, so that they build up in averages. This contrasts with many other cases of induced oscillations that flatten out with averaging and can be seen only in single sweeps.
By definition (see B.2., above), the OSPs at each level are not predictable from the EPs at that ISI. The mechanism of the electrosensory OSP, like that suggested for the visual OSP in the same animals (Bullock et al. 1990), must depend, at the within-train frequencies used, primarily upon an active suppressing effect of each stimulus in a train, since after the first stimulus the evoked response declines and is held down by continued stimulation, although ready to rebound any time a stimulus is omitted. The equilibrium level of accumulated suppression, higher for longer trains and shorter ISIs, determines the latency of the rebound. The accumulation might well have both longer and shorter components, due to total train length, mean ISI and other weak factors for the longer components and to very recent ISIs for the shorter, stronger components. These functions are together just right for a constant latency over some wide range of ISIs - longer for the forebrain than for the midbrain. Beyond this we cannot speculate upon mechanism but this much indicates that it need not depend on higher brain levels; it can be largely a low level, early process. This conclusion contrasts with the usual current view based on human scalp recording; Jones (1992), for example, believes that OSPs must come from higher order neurons that respond to a mismatch between the input and an image in a short-term sensory store. Baar-Eroglu et al. (1991) find the OSP already in the reticular formation of the mesencephalon in cats, in agreement with our results, although neither study excluded the possibility of a descending influence. That was done in our earlier study of visually evoked OSPs, already visible in the retina, after cutting the optic nerve (Bullock et al. 1990).
|
|
References/Acknowledgements |
|
|
|---|
Acknowledgements. Aided by grants to T.H.B. from the National Institute of Neurological Diseases and Stroke and the National Science Foundation. S.K. was supported by the government of Turkey; M.H.H. by the German Science Foundation.
Akoev GN, Andrianov GN (1989) Synaptic transmission in the mechano- and electroreceptors of the acousticolateral system. Progr Sens Physiol 9:53-95
Akoev GN, Ilyinsky OB, Zadan PM (1976a) Responses of electroreceptors (ampullae of Lorenzini) of skates to electric and magnetic fields. J Comp Physiol 106:127-136
Akoev GN, Ilyinsky OB, Zadan PM (1976b) Physiological properties of electroreceptors of marine skates. Comp Biochem Physiol 53A:201-209
Andrianov YN, Broun GR, Ilinskii OB, Muraveiko VM (1985) Frequency characteristics of skate electroreceptive central neurons responding to electrical and magnetic stimulation. Neurophysiology 16:364-369
Barlow JS, Morrell L, Morrell F (1965) On evoked responses in relation to temporal conditioning to paired stimuli in man. MIT Res Lab Electron Quart Prog Rep 78:263-272
Baar E, Bullock TH (1992) Induced Rhythms in the Brain. Birkhäuser, Boston
Baar-Eroglu C, Baar E, Schmielau F (1991) P300 in freely moving cats with intracranial electrodes. Int J Neurosci 60:215-226
Bodznick DA, Northcutt RG (1980) Segregation of electro- and mechanoreceptive inputs to the elasmobranch medulla. Brain Res 195:313-321
Bodznick D, Northcutt RG (1984) An electrosensory area in the telencephalon of the little skate, Raja erinacea. Brain Res 298:117-124
Bromm B, Hensel H, Tagmat AT (1976) The electrosensitivity of ampullae of Lorenzini in the dogfish. J Comp Physiol 111:127-136
Broun GR, Ilyinski OB (1984) The physiology of electroreceptors. Nauka, Leningrad
Broun GR, Ilyinsky OB, Volkova NK (1972) The study of some properties of electroreceptor structures of the lateral line in skates. Fiziol Zh SSSR IM I M Sechenova 58:1499-1505
Bullock TH (1979) Processing of ampullary input in the brain: comparison of sensitivity and evoked responses among elasmobranch and siluriform fishes. J Physiol (Paris) 75:397-407
Bullock TH (1988) The comparative neurology of expectation: stimulus acquisition and neurobiology of anticipated and unanticipated input. In: Atema J, Fay RR, Popper AN, Tavolga WN (eds) Sensory biology of aquatic animals Springer-Verlag, New York, pp 269-284
Bullock TH, Hofmann MH (1991) Apparent expectation in interstimulus-interval-specific event related potentials to omitted stimuli in the electrosensory pathway of elasmobranchs. Soc Neurosci Abstr 17:303
Bullock TH, Bodznick DA, Northcutt RG (1983) The phylogenetic distribution of electroreception: evidence for convergent evolution of a primitive vertebrate sense modality. Brain Res 6:25-46
Bullock TH, Hofmann MH, Nahm FK, New JG, Prechtl JC (1990) Event-related potentials in the retina and optic tectum of fish. J Neurophysiol 54:903-914
Courchesne E (1979) From infancy to adulthood: the neurophysiological correlates of cognition. In: Desmedt JE (ed) Cognitive components in cerebral event-related potentials and selective attention. S. Karger, Basel, pp 224-242
Fields RD, Bullock TH, Lange GD, Bodznick D (1992) Ampullary sense organs, peripheral, central and behavioral electroreception in chimeras (Hydrolagus, Holocephali, Chondrichthyes). Brain Behav Evol, In press
Ford JM, Hillyard SA (1981) Event-Related Potentials (ERPs) to interruptions of a steady rhythm. Psychophysiology 18:322-330
Hillyard SA, Picton TW (1979) Event-related brain potentials and selective information processing in man. In: Desmedt JE (ed) Cognitive components in cerebral event-related potentials and selective attention. S. Karger, Basel, pp 1-52
Jones SJ (1992) AEPs at the onset and offset of repetitive sound modulation, due to mismatch with the contents of an auditory sensory store. Electroencephalogr Clin Neurophysiol 84:149-156
Kalmijn AJ (1974) The detection of electric fields from inanimate and animate sources other than electric organs. In: Fessard A (ed) Handbook of sensory physiology, vol III/3: electroreceptors and other specialized receptors in lower vertebrates. Springer, Berlin Heidelberg New York, pp 147-200
Klinke R, Fruhstorfer H, Finkenzeller P (1968) Evoked responses as a function of external and stored information. Electroencephalogr Clin Neurophysiol 25:119-122
McCallum WC (1980) Brain slow potential changes elicited by missing stimuli and by externally paced voluntary responses. Biol Psychol 11:7-19
Montgomery JC (1984) Frequency response characteristics of primary and secondary neurons in the electrosensory system of the thornback ray. Comp Biochem Physiol 79A:189-195
Murray RW (1965a) Electroreceptor mechanisms: the relation of impulse frequency to stimulus strength and responses to pulsed stimuli in the ampullae of Lorenzini of elasmobranchs. J Physiol 180:592-606
Murray RW (1965b) Receptor mechanisms in the ampullae of Lorenzini of elasmobranch fishes. Cold Spring Harbor Symp Quant Biol 30:245-262
Murray RW (1967) The function of the ampullae of Lorenzini of elasmobranchs. In: Cahn P (ed) Lateral line detectors. Indiana University Press, Bloomington, pp 277-293
Murray RW (1974) The ampullae of Lorenzini. In: Fessard A (ed) Handbook of sensory physiology, vol III/3: electroreceptors and other specialized receptors in lower vertebrates. Springer, Berlin Heidelberg New York, pp 125-146
New JG, Bodznick D (1985) Segregation of electroreceptive and mechanoreceptive lateral line afferents in the hindbrain of chondrostean fishes. Brain Res 336:89-98
Obara S, Bennett MVL (1972) Mode of operation of ampullae of Lorenzini of the skate, Raja. J Gen Physiol 60:534-557
Picton TW, Hillyard SA, Galambos R (1974) Cortical evoked responses to omitted stimuli. In: Livanov MN (ed) Major problems of brain electrophysiology. USSR Academy of Science, pp 302-311
Platt CJ, Bullock TH, Czéh G, Kovaevi N, Konjevi Dj, Gojkovi M (1974) Comparison of electroreceptor, mechanoreceptor and optic evoked potentials in the brain of some rays and sharks. J Comp Physiol 95:323-355
Prechtl JC, Bullock TH (1992) Barbiturate sensitive components of visual ERPs in a reptile. Neuroreport (in press)
Renault B, Lesevre N (1977) Topographical study of the emitted potential obtained after the omission of an expected visual stimulus. In: Otto DA (ed) Multidisciplinary perspectives in event-related brain potential research. National Technical Information Service, Springfield VA, pp 202-208
Ritter W, Simson R, Vaughan HG (1979) Topographic analysis of task-related cerebral potentials. In: Desmedt JE (ed) Cognitive components in cerebral event-related potentials and selective attention. S. Karger, Basel, pp 132-139
Ruchkin DS, Sutton S (1979a) CNV and P300 relationships for emitted and for evoked cerebral potentials. In: Desmedt JE (ed) Cognitive components in cerebral event-related potentials and selective attention. S. Karger, Basel, pp 119-131
Ruchkin DS, Sutton S (1979b) Latency characteristics and trial-by-trial variations of emitted cerebral potentials. In: Desmedt JE (ed) Cognitive components in cerebral event-related potentials and selective attention. S. Karger, Basel, pp 106-118
Rusinov VS (1960) General and localized alterations in the electroencephalogram during the formation of conditioned reflexes in man. Electroencephalogr Clin Neurophysiol 13:309-319
Schweitzer J (1986a) Functional organization of the electroreceptive midbrain in an elasmobranch (Platyrhinoidis triseriata): a single unit study. J Comp Physiol 158:43-58
Schweitzer J (1986b) The neural basis of electroreception in elasmobranchs. In: Uyeno T, Arai R, Taniuchi T, Matsuura K (eds) Indo-Pacific fish biology. Ichthyological Society of Japan, Tokyo, pp 392-407
Squires NK, Squires KC, Hillyard SA (1977) Functional equivalence of signal-present, signal-absent, and threshold-detect P3s. In: Otto DA (ed) Multidisciplinary perspectives in event-related brain potential research. National Technical Information Service, Springfield VA, pp 218-221
Sutton S, Braren M, Zubin J, John ER (1965) Evoked-potential correlates of stimulus uncertainty. Science 150:1187-1188
Sutton S, Tueting P, Zubin J, John ER (1967) Information delivery and the sensory evoked potential. Science 155:1436-1439
Takasaka Y (1985) Expectancy-related cerebral potentials associated with voluntary time estimation and omitted stimulus. Folia Psychiatr Neurol Jpn 39:167-172
Zakon H (1986) The electroreceptive periphery. In: Bullock TH, Heiligenberg W (eds) Electroreception. John Wiley & Sons, New York, pp 103-156