T.H. Bullock
Neurobiology Unit
Scripps Institution of Oceanography and Department of Neurosciences
School of Medicine
University of California, San Diego
La Jolla, CA 92093-0201, U.S.A.
e-mail: tbullock@ucsd.edu
|
|
Summary |
To exploit comparisons among classes of vertebrates and invertebrates, and between higher and lower levels of the brain, and between modalities, some important needs and opportunities for new research into the way central processing of acoustic input takes place are pointed out. Most of these are suggested by unfamiliar results on fish and reptiles that call for new controls in mammalian experiments as well as more systematic study of nonmammalian taxa. Three frameworks or basic agendas are outlined: (i) systematic comparison of dynamical properties to acoustic variables, including especially repetition at different rates and the related states of expectation; (ii) comparison of response measures, including especially sequences such as oscillations and measures of assembly cooperativity such as synchrony, coherence and bicoherence; and (iii) comparison of auditory subsystems, including especially modal categories such as complex feature selective regions and small sets.
Some recent and some new results are summarized on human acoustic and nonmammalian Event Related Potentials (ERPs) in response to expectations. When a regular and frequent standard stimulus is omitted, the Omitted Stimulus Potential (OSP) after conditioning with low repetition rates (long ISIs - 1-3 s) is a slow, broad positivity (P600-900), previously known. With high rates (ISI <1 s), a new form of response appears, with fast components (P22), different dynamics and less dependence on attention. Slow and fast OSPs each show a constant peak latency after the due-time of the missing stimulus, as though a temporal expectation has been learned. Unlike the visual OSP we have reported earlier, both fast and slow can occur together in the 1-2 Hz range. Very few conditioning stimuli suffice to create the "expectation" that causes an OSP - only two for the slow type. These and more familiar ERPs, considered in human subjects to index cognitive events, need to be compared in other classes of vertebrates and invertebrates.
This contribution has two aims. First, it points out some needs and opportunities for new research into the way central processing of acoustic and other sensory input takes place, emphasizing the advantages of comparisons among classes of vertebrates and invertebrates, and between higher and lower levels of the brain. Second, some new findings are summarized to illustrate this approach. The first aim will be illustrated from three perspectives (frameworks, agendas), formulated above in the summary.
|
|
Systematic comparison of stimulus variables, including repetition rate. |
|
|
|---|
One agenda would be concerned first with the parametric application of the principal stimulus variables, acoustic or others, in such a way as to permit comparison of animals as well as brain levels and states. For convenience, I segregate two categories.
A. The first focuses on the basic physical variables of sound. At present our information on
the physiological evolution of hearing among the taxa of animals with hearing is almost confined to tuning curves, frequency ranges and thresholds, with some notable exceptions, especially in amphibian midbrains [1, 2, 3]. Inadequately known, especially in a series of species of different vertebrate classes, in a systematic, parametric manner are the dynamical properties of electrophysiological responses of units and assemblies to permutations of the elementary variables, such as duration, intensity and quality (frequency and mixtures of frequencies of different intensities) and especially repetition with its variables of rate, pattern and numerical order. The matrix of such variables and permutations is too large for a practical agenda. Nevertheless, some selection of them, compared at different levels from receptor to first nucleus, to later nuclei and cortical areas in different evolutionary grades is important. Otherwise, with only one parameter such as a tuning curve, we can hardly claim to have even an approximate picture of the evolutionary variance of this sensory system.
B. The second focuses on the biological variables in the organism, particularly its behavioral or brain state. Brain state is used here to embrace behavioral moods, states of readiness, arousal, expectation or directed attention, disease and developmental states. The last two are explicitly included as offering opportunities under the comparative approach being advocated, but will not be further elaborated here. Of the great range of biological variables, behavioral and brain states, I will only enlarge upon a few of the opportunities to obtain basic information about responses to expected and unexpected stimuli. A considerable older literature deals with arousal and the "reticular activating system," mainly in cats [4] and has been revisited and reinterpreted [5, 6]. Laming and associates have more recently described some central events associated with arousal in fish and amphibians [7, 8, 9]. Cortical compound field potential responses to novel stimuli have been extensively investigated in a few mammalian species, especially humans, using limited technical approaches and preparations, under such designations as "mismatch potentials" and "oddball potentials" - two of the classes of "Event Related Potentials" (ERPs). Responses to expected stimuli, showing habituation or adaptation have also been studied under such designations as Steady State Responses (SSRs)[10].
A few reports have dealt with the absence of expected stimuli, with designations such as Omitted Stimulus Potentials (OSPs) [11, 12, 13, 14, 15, 16]. Most of these studies have been done from the human scalp, with the benefit of attention and trains of regular stimuli at 0.3-1 Hz, giving a late positivity usually considered a form of P300 but actually peaking at 600-900 ms or later.
We recently reported a second kind of OSP from the human scalp [16], using trains of visual stimuli at "high" frequency (5-20 Hz). Having an earlier (P200) and more complex form, it is called the "fast OSP" and is not dependent on attention. Recent experiments with click trains, by my colleague, S. Karamürsel, show similar slow (0.3-3 Hz) and fast OSPs, each with its constant peak latency after the due-time of the missing stimulus (Fig. 1). Slow click trains sometimes show two or more successive OSPs on schedule, if the stimuli are omitted. "High" and "low" effective click frequencies overlap so that click trains in the 1-3 Hz range can give both kinds of OSP, whereas flash trains show a zone of no OSP between ca. 2 and 5 Hz. Very few conditioning stimuli are required to create the "expectation" of something at that interstimulus interval (ISI); only two stimuli (one ISI) are necessary for the slow OSP. Introducing jitter on the ISI has different effects for the visual and the acoustic OSPs. Both visual and acoustic trains at a critical ISI cause alternately larger and smaller evoked potentials in the steady state response and consecutive clicks can be heard differently. An expectation of a rare stimulus ("oddball") can be created by using a consistent pattern, e.g. 4 standard stimuli followed by the oddball, so that substituting a standard in place of the expected oddball gives an unexpected standard potential (USP).
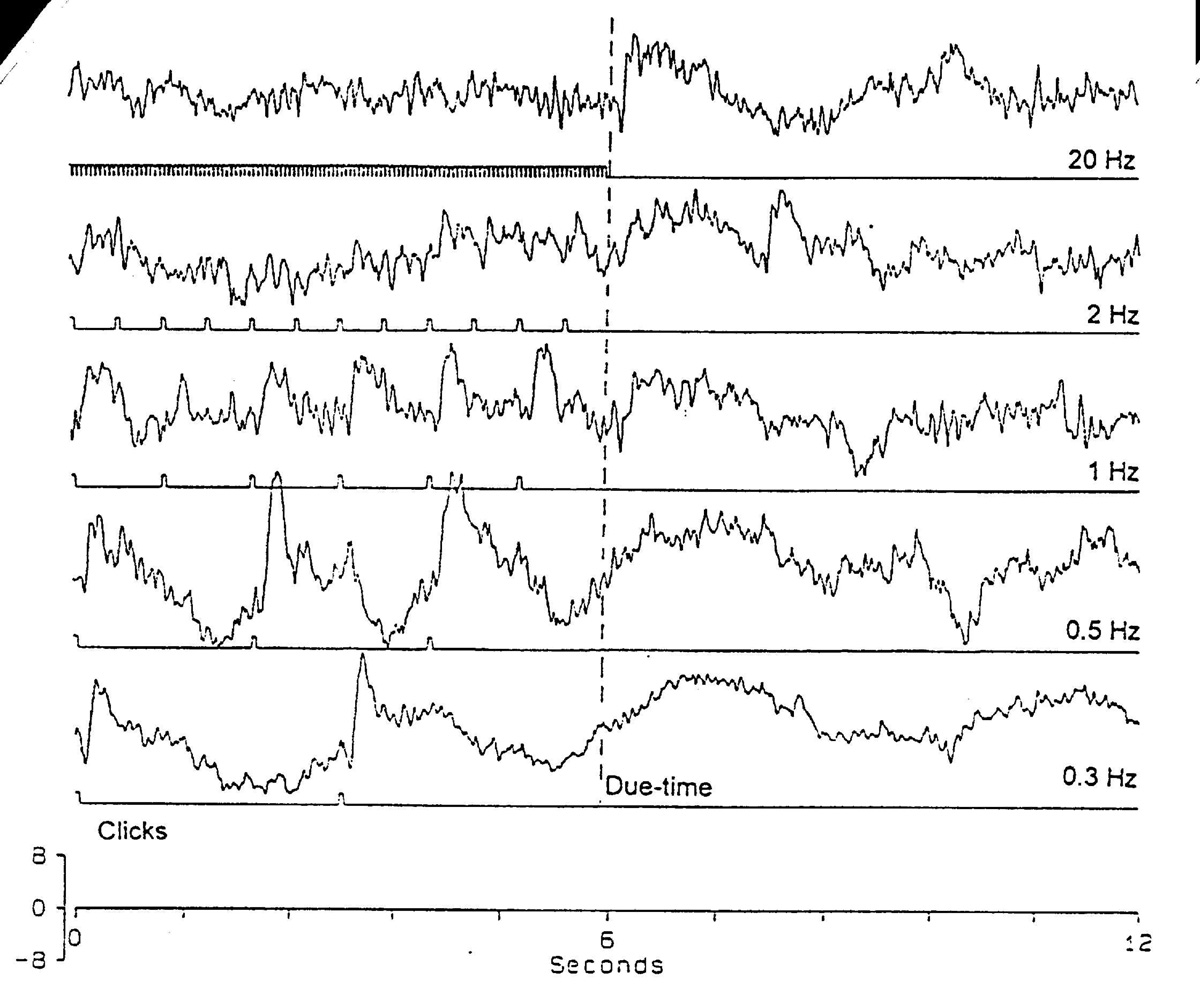 |
Figure 1. Auditory omitted stimulus potentials. Human scalp, CZ electrode, 0.1-30 Hz band, 0.3 ms click stimulus, average of 10 sweeps (courtesy of S. Karamürsel). Dashed line is the due-time of the first omitted click. The train was terminated to avoid confounding the OSP with auditory evoked potentials. Note large steady state response evoked potentials up to 1 Hz. The slow, rounded P900 after the omission at 0.3 Hz shows the expectation already before the omission by the start of the positivity; it requires attention to the timing. The fast OSP at 1-20 Hz (P ca. 200) does not require attention and the mixture of the two kinds of OSP in the transition zone (1-3 Hz) probably depends on such state variables. |
In the few works on nonmammalian species it has been found that ERPs, including mismatch, oddball and even OSPs occur in turtles, teleosts and rays in the visual modality, even without attention, already in brainstem levels and even in the retina [13, 17, 14, 18-20]. OSPs were found in the primary medullary nuclei of rays to omitted electrosensory stimuli [21]. In the context of their usual classification as "cognitive" waves, it is important to investigate them further, in two directions. One direction is different levels of the brain in different taxa and modalities, including acoustic, somatosensory and electroreception of microvolt electric currents, known in many groups of fish and amphibians. The other direction is to test for changes with different brain states such as alert, distracted, generalized arousal, directed attention, sleep and spontaneous fluctuations (like the "minute rhythms" of Makeig et al. 1985 [10].
|
|
Comparison of cooperativity in sequences and oscillations |
|
|
|---|
A second agenda or basis for comparison among taxa, levels and brain states would be concerned with somewhat more complex measures that reveal the spatiotemporal pattern of activity in organized arrays of neural elements. Is there evolution in measures such as the following?
A. Measures of cooperativity among assemblies of cells have usually meant comparisons of the compound field potentials seen by different electrodes in the same brain (e.g. electrocorticogram, electroencephalogram) in order to look for some kind of correlation or interdependency between loci. More revealing than correlations is coherence which estimates the degree of congruence between two records (electrodes, channels, time-series) at each frequency; more precisely it is the fraction of the normalized energy, for each of its frequency components,
which is in a constant phase throughout the chosen sample epoch, whatever phase it may be. By using many electrodes and computing for pairs at different distances apart, even such a difficult property as synchrony, can be quantified, as the rate of decline with distance, for each frequency component [22, 23, 24]. This measure assumes linearity, stationarity and independence of frequencies, none of which is found to be generally true for more than limited epochs and samples.
Higher moments and nonlinear measures can be sampled, among other methods, by the bispectrum and bicoherence which look for nonGaussian distributions and nonlinearities such as skewness, asymmetry and quadratic phase coupling between every combination of frequency components in the same channel or across channels. Only some preliminary results of such analyses have been reported [25], [26, 27, 28, 29]. It is absent much of the time in subdural cortical surface placements and in probes deep in the temporal lobes, amygdala and hippocampus in humans. Quadratic phase coupling (bicoherence) can be pronounced in one electrode and not the adjacent one whose EEG looks the same, or in one 9 s sample and not the next one (Fig. 2) whose EEG looks similar. Some of the EEG features that cause bicoherence are not noticeable to the eye in the raw record. Bicoherence can be due to transient sharp corners, such as square steps, triangular and sawtooth waves and spikes, or to sustained modulations such as amplitude, frequency and phase modulations providing some of the modulating frequency is in the signal, besides the modulated wave form. Bicoherence can be very local and rapidly changing. In a sample of subjects, it is higher, on average in stage II-III sleep than awake and reaches its maximum in some stages of seizures, although others have little or none above the chance level.
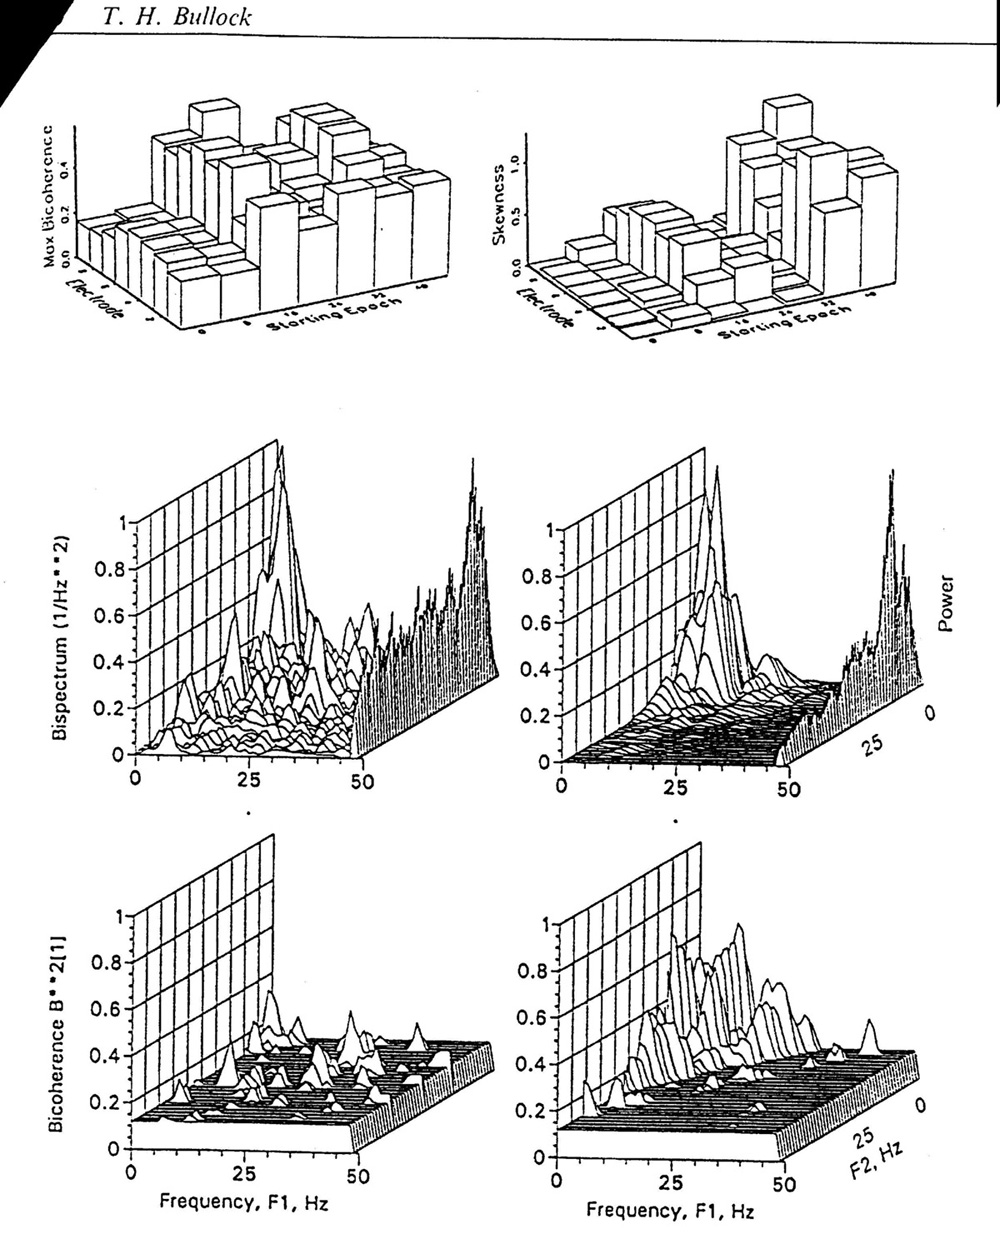 |
Figure 2. Bicoherence as a measure of cooperativity. Human EEG for 64 s, depth electrodes in the hippocampus (courtesy of Drs. S.S. Spencer and R.B. Duckrow). Top, left: Each bar the maximum bicoherence during one 9 s period, in one of 8 electrode along the depth probe, 6.5 mm apart. A seizure starts in the 3rd column. Top, right: Same for mean skewness. Middle, left: Bispectrum of one channel computed for the 9 s just before seizure start (second column of bars in the top), shown for each pair of frequencies between <1 and 50 Hz. This measure ignores all Gaussian, linear components and combines skewness, asymmetry around the voltage axis, bicoherence and power. Ordinate in arbitrary units, scaled to the maximum. On the right edge the amplitude spectrum, in arbitrary units. Middle, right: Same for the adjacent electrode channel. The bispectrum peak is ca. 4 times higher than in the left hand channel and the amplitude spectrum peak ca. 9 times higher. Bottom, left: Bicoherence for the same electrode and period as the bispectrum just above. This measure shows the proportion of the power at each F1, F2 intersection that is quadratically phase coupled, above the plane representing the 95% confidence level. This shows a very low level of bicoherence, scattered over the bifrequency plane. Bottom, right: Same for the next electrode shows highly significant bicoherence in one corner. Bicoherence can be quite different in adjacent electrodes and in adjacent 9 s periods; it increases during seizure and so does skewness, but the two are not well correlated. |
B. Occurrence of oscillations in the compound field potential from gross or semimicroelectrodes on or in the brain has enjoyed a recent spurt of interest with the findings [30, 31, 32, 33, 34] that adjacent columns in the visual cortex may have distinct, noncongruent, ca. 35-50 Hz oscillations and corresponding clumps of spikes, lasting a second or so, triggered by special kinds of stimuli. These transient rhythms have been associated either with an inferred stage in visual processing called binding or, more loosely, with cognitive processes [35, 36]. Rhythms in the 40 Hz range have also been reported in auditory experiments and elsewhere [37]. I have opined, in the last reference cited, that the various examples are not all equivalent in functional meaning or in mechanism but represent a variety of each. The example in Figure 3 shows that the mesencephalic tectum in an elasmobranch can exhibit conspicuous 12-15 Hz oscllations beginning 300 ms after the onset of a long (5 s) light pulse and less clear, slower oscillations with a similar latency after the offset. These rhythms begin already in the retina. More or less sustained neural oscillations of other frequency ranges are known from circadian to >1000 Hz in some electric fish. Their meanings are only fragmentarily known in most cases. In some a good deal has been discovered about the cellular or circuit mechanisms [38, 39, 40, 41, 42, 43].
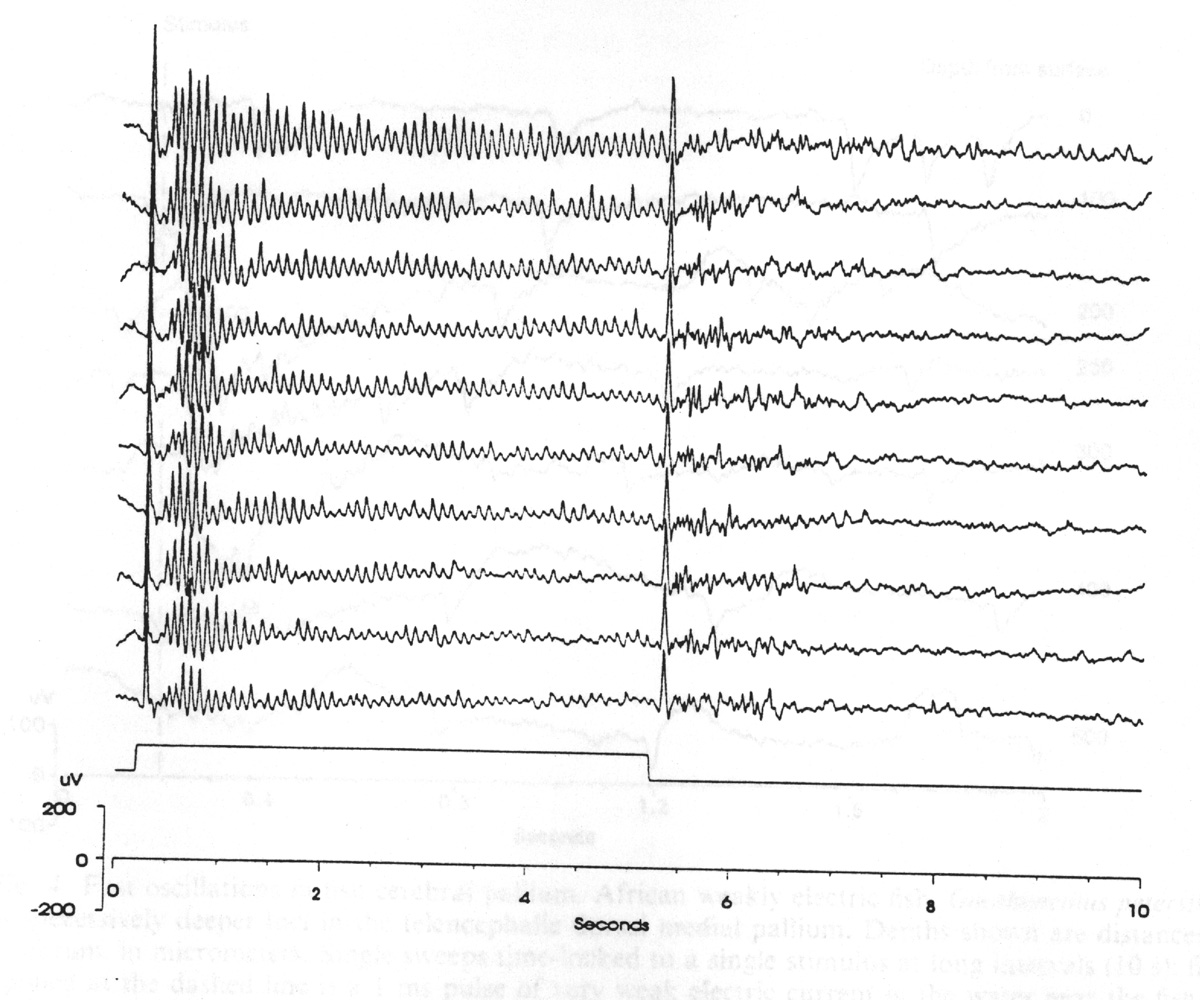 |
Figure 3. Induced rhythms in the midbrain of a ray. Thornback ray, Platyrhinoidis with semimicroelectrode in the tectum opticum; single sweeps (10 s). 5 s pulses of light at long interstimulus intervals cause a large N90 visual evoked potential after ON, followed by induced 12 Hz sustained oscillations and a large N150 after OFF, with more complex fluctuations. (Original, kindness of M.H. Hofmann) |
Besides the questions of functional roles and of origin of the rhythms, we can widen the issue to how and why neural activity is correlated where it is. Recent theoretical ideas place great weight on such correlation as a possible secret of neural representation of information. (I use neural rather than neuronal to imply that neuroglia might be playing significant roles apart from slow recovery and mopping up functions.) It is therefore of more than zoological interest to compare the nature and degree of correlated activity in diverse preparations from lower and higher taxa, brain levels and brain states, whether it is tighter or looser correlation of spikes or the population synchrony of slow potentials. This brings us back to the message of the previous section (A.), that compound field potentials of assemblies of cells, reflecting all of these processes, are a candidate entrance into the complexities of group dynamics and deserve attention from the comparative or evolutionary approach.
The example I illustrate in Figure 4 is a cerebral evoked potential from a teleost fish; the modality is electroreception - quite closely related to the auditory in parallel pathways. An induced rhythm of ca.30 Hz is visible in single sweeps but reduced in averages. These responses and similar ones to light, sound [44] and water movement (lateral line reception [45, 46] underline that the forebrain sensory processing is very different in nonmammals from the familiar primary sensory cortex in mammals. Evoked and induced oscillatory responses have been reported also in reptiles [47, 48] This domain underlines the advantages of finding favorable preparations as well as the difficulties of comparison.
 |
Figure 4. Fast oscillations in fish cerebral pallium. African weakly electric fish, Gnathonemus petersii, with semimicroelectrode at successively deeper loci in the telencephalic dorsal medial pallium. Depths shown are distances below the surface of the cerebrum, in micrometers. Single sweeps time-locked to a single stimulus at long intervals (10 s); filters 0.3-50 Hz. Stimulus applied at the dashed line is a 1 ms pulse of very weak electric current in the water near the fish. Note that this causes an evoked negative shift (N100) and 30 Hz oscillation only in the three middle traces, around 250 m. The repeated negative spikes, 3-5 per sweep, are consequences of the spontaneous 0.2 ms, ca. 1-3 / s electric organ discharges. (Original, courtesy of J.C. Prechtl). |
C. Another domain where favorable preparations and comparison may lead to new insights is the roles of efferents to receptors, not only in various taxa but in various modalities, like the non-cochlear acoustic modality in fish and amphibians, visual, vestibular, electroreceptive, even stretch and tactile (vibrissae and ordinary hairs) and chemoreceptors. This includes the roles of autonomic influence on receptors, as in tactile and gustatory afferents [49, 50, 51]. The larger issue of which this is a part is the roles of descending influence from higher brain levels upon earlier stations in the afferent pathways. A considerable body of information is known but not enough to discern the big picture as between higher and lower taxa (i.e. taxa with more complex and less complex brains), and between modalities and brain states.
|
|
Comparative study of complex recognition cells and subsystems. |
|
|
|---|
The use of a variety of taxa has been particularly important in discovering and evaluating neurons with complex feature selectivity. This area of problems in fact grades into that of classifying types of neurons on the one hand and into distinguishing afferent subsystems on the other. The former is well illustrated by the history of classifying retinal ganglion cell types [52] and cochlear nerve fiber types [53, 54]. The distinction of subsystems became a hotly debated topic with the differentiation of "two visual systems" in hamsters [55], followed shortly by two auditory systems in dolphins [56, 57].
A. More effort is needed, ethologically-guided, to find complex-feature-selective cells and regions, like the face units in primate temporal cortex. I am advocating more work like Suga's [58] in bat cortex, Winter and Funkenstein's [59] on squirrel-monkey (marmoset) vocal call-selective units; that of Margoliash [60, 61] and others on song-selective units in song birds, Benson and Perrett [62], Perrett et al. [63], Wilson and Rolls [64] and Rolls et al. [65] on cells in primates sensitive to distinctive faces. These highly specific units, which must represent the convergence of complex spatio-temporal arrays onto small sets that may not require a specific pattern among them, are still not understood in respect to their limitations, for instance to certain classes of stimuli or kinds of response.
Single units are not the only route to uncovering organization. Multiunit activity ("MUA") is usually construed to mean the spikes of several and "hash" to mean small spikes of many units. These endpoints as well as slow, evoked or event related potentials can be the first indication of some localized response to interesting stimuli or situations.
Closely related is the body of data showing quite narrow and specific deficits following circumscribed lesions. Nielsen [66] described selective blindness to animate objects or objects associated with living beings - flowers and false teeth as well as horses and dogs. Anosognosia, denial of half the visual field or of half of one's own body as well as other suggestions of localized functions of unexpectedly specific sorts have become familiar from recent popular writings [67, 68]. Rather than simply waiting for fortunately limited clinical cases, the importance of understanding these suggestions calls for experimental lesions in laboratory animals of different classes and orders, with good ethological observation. The same can be said of microstimulation, including chronic, low level biasing of probabilities of response [69, 70].
The wide range of examples, from the earliest complex visual units in crustacean optic lobes [71, 72, 73] and those of Lettvin et al. [74], Maturana et al. [75] in the frog retina and deep tectum [76] to the action-centered units in simian temporal cortex [77, 78, 79, 80] point to the possibility of a much wider employment of localized small sets of cells representing complex configurations of antecedent cells. Even though this class of cells is not in vogue today, being dismissed as too close to "grandmother cells" [81] and inconceivable as the normal mechanism for the vast majority of our recognitions, they exist and should be studied if only to learn how far they go and whether they are fewer in higher animals, as is often supposed, or actually more numerous and specialized..
B. Distinguishing subsystems among afferent pathways is probably still in an early stage. In addition to local regions, whole subsystems or pathways have gradually come to light, especially in vision and more recently in audition. Two broad categories were described in dolphins [56, 57], one for abrupt-rising, fractional millisecond, ultrasonic clicks used for echo-locating and the other for slowly rising, longer lasting, low frequency social communicating sounds, processed in quite different places. In cats a timing subsystem has been distinguished
from a frequency analyzing subsystem, although the anatomical separation is not so obvious [82].
Where single units can be recorded from in sufficient numbers and variety, we should seek to define those stimuli whose ethological meaning is (i) scalar, like the continuous estimation of azimuth or distance or intensity or control of eye movements or the "Jamming Avoidance Response" in wave species of electric fish from those natural acoustic stimuli whose meaning is (ii) more modal, qualitative or decisive in switching behavior, like call recognition. This might help to distinguish their respective methods of processing. We really understand little about the organization of processing although there have been proposals put forward. Some of these are (i) so-called democratic vs oligarchic systems; (ii) winner-take-all vs continuous, graded output; (iii) large numbers of cells in a complex spatiotemporal pattern vs small numbers of more or less equivalent recognition cells in no special pattern (mentioned in A., above); (iv) push-pull systems with opposing half-centers as in ON-center & OFF-center retinal ganglion cells, and in appetite and thirst control vs single centers, either excited or inhibited; (v) sensory-surface mapped systems like cochleotopic and somatotopic maps vs computed maps, like the acoustic space maps of Knudsen and Konishi [83], Knudsen [84] in owls.
|
|
Coda |
The selected examples of opportunities for new research may assist investigators looking for a point of entry with a high probability of discovering unexpected phenomena and even principles. Such findings will improve and may significantly correct our notions of how the brain evolved, particularly in the relatively less understood realms of evolution of physiological operations. Indeed, until we have a reasonably good picture of the functional organization and dynamics of the available, living representatives of ancestral taxa, we can hardly claim to understand the choices of mechanisms found in ourselves or other derivative animals.
|
|
References |
1 Capranica RR, Moffat AJM. J Comp Physiol 1975; 100: 231-249.
2 Mudry KM, Capranica RR. J Comp Physiol A 1987; 160: 477-489.
3 Mudry KM, Capranica RR. J Comp Physiol A 1987; 161: 407-416.
4 Magoun HW. The Waking Brain. Springfield, IL: Charles C. Thomas, 1958.
5 Hobson JA, Brazier MAB. The Reticular Formation Revisited: Specifying Function for a Nonspecific system. New York: Raven Press, 1980.
6 Vanderwolf CH, Robinson TE. Behav Brain Sci 1981; 4: 459-514.
7 Laming PR, Bullock TH. Comp Biochem Physiol A 1991; 99A: 567-575.
8 Laming PR, Bullock TH, McClune MC. Comp Biochem Physiol A 1991; 100A: 95-104.
9 Laming PR, Bullock TH, McClune MC. Comp Biochem Physiol A 1991; 100A: 81-93.
10 Makeig S, Galambos R, Stapells DR. Electroencephalogr Clin Neurophysiol 1985; 61: S66.
11 Chelidze LR. In: Sokolov EN, Vinogradova OS, eds. Neuronal Mechanisms of the Orienting Reflex. Hillsdale, NJ: Lawrence Erlbaum Associates, 1975; 52-62.
12 Hillyard SA, Picton TW. In: Desmedt JE, ed. Cognitive Components in Cerebral Event-Related Potentials and Selective Attention. Basel: S. Karger, 1979; 1-52.
13 Bullock TH, Hofmann MH, Nahm FK, New JG, et al. J Neurophysiol 1990; 64: 903-914.
14 Prechtl JC, Bullock TH. Electroencephalogr Clin Neurophysiol 1994; 91: 54-66.
15 Karamürsel S, Bullock TH. Electroencephalogr Clin Neurophysiol 1994; 90: 461-471.
16 Bullock TH, Karamürsel S, Achimowicz JZ, McClune MC, et al. Electroencephalogr Clin Neurophysiol 1994; 91: 42-53.
17 Bullock TH, Karamürsel S, Hofmann MH. J Comp Physiol A 1993; 172: 501-510.
18 Bullock TH. Biol Bull 1945; 89: 185-186.
19 Bullock TH. Anat Rec 1942; 84: 18-19.
20 Bullock TH. Nature 1946; 158: 555-556.
21 Bullock TH, Karamürsel S, Hofmann MH. J Comp Physiol A 1993; 173: 749.
22 Bullock TH, McClune MC. Electroencephalogr Clin Neurophysiol 1989; 73: 479-498.
23 Bullock TH, McClune MC, Achimowicz JZ, Iragui-Madoz VJ, et al. Electroencephalogr Clin Neurophysiol 1995; 95: 161-177.
24 Bullock TH, McClune MC, Achimowicz JZ, Iragui-Madoz VJ, et al. Proc Natl Acad Sci USA 1995; 92: 11568-11572.
25 Ning T, Bronzino JD. IEEE Trans Biomed Engr 1989; 36: 497-499.
26 Sherman DL. Novel Techniques for the Detection and Estimation of Three-Wave Coupling with Application to Human Brain Waves. Purdue University, Ph.D. Thesis, 1993.
27 Achimowicz JZ, Bullock TH. Proc Ann Res Symp , INC, Univ of Calif , San Diego 1993; 3: 29-49.
28 Achimowicz JZ, Bullock TH. Soc Neurosci Abstr 1993; 19: 1605.
29 Bullock TH, Achimowicz JZ. In: Pantev C, Elbert T, Lütkenhöner B, eds. Oscillatory Event Related Brain Dynamics. New York: Plenum Press, 1994; 11-26.
30 Eckhorn R, Bauer R, Jordan W, Brosch M, et al. Biol Cybern 1988; 60: 121-130.
31 Eckhorn R, Reitböck HJ, Arndt M, Dicke P. Neural Computation 1990; 2: 293-307.
32 Gray CM, Singer W. Neuroscience 1987; (Suppl.)22: 1301P.
33 Gray CM, Singer W. Soc Neurosci Abstr 1987; #404.3.
34 Gray CM, König P, Engel AK, Singer W. Nature (Lond ) 1989; 338: 334-337.
35 Baar E, Baar-Eroglu C, Röschke J, Schürmann M. In: Z schocke S, Speckmann E-J , eds). Basic Mechanisms of the EEG. Boston: Birkhäuser, 1993; 73-95.
36 Gray CM. In: Nadel L, Stein D, eds. Lectures in Complex Systems (SFI Studies in the Sciences of Complexity, Lect. Vol. V). Reading, MA: Addison-Wesley, 1993; 89-161.
37 Bullock TH. In: Baar E, Bullock TH, eds. Induced Rhythms in the Brain. Boston: Birkhäuser, 1992; 1-26.
38 Lopes da Silva FH, Vos JE, Mooibroek J, van Rotterdam A. Electroencephalogr Clin Neurophysiol 1980; 50: 449-456.
39 Strumwasser F. J Physiol (Paris) 1988; 83: 246-254.
40 Leresche N, Jassik-Gerschenfeld D, Haby M, Soltesz I, et al. Neurosci Lett 1990; 113: 72-77.
41 Marder E, Abbott LF, Kepler TB, Hooper SL. In: Baar E, Bullock TH, eds. Induced Rhythms in the Brain. Boston: Birkhäuser, 1992; 287-296.
42 Steriade M, Curró Dossi R, Contreras D. Neuroscience 1993; 56: 1-9.
43 Garcia-Muñoz A, Barrio LC, Buño W. Exp Brain Res 1993; 97: 325-333.
44 Echteler SM. J Comp Physiol 1985; 156: 267-280.
45 Bleckmann H, Bullock TH. In: Coombs S, Görner P, Münz H, eds. The Mechanosensory Lateral Line. New York: Springer-Verlag, 1989; 387-408.
46 Bleckmann H, Weiss O, Bullock TH. J Comp Physiol A 1989; 164: 459-474.
47 Prechtl JC. Proc Natl Acad Sci USA 1994; 91: 12467-12471.
48 Prechtl JC, Bullock TH. Proc 2nd Joint Symp on Neural Computation, University of California, San Diego 1995; 5: 114.
49 Loewenstein WR. J Physiol 1956; 132: 40-60.
50 Chernetski KE. J Neurophysiol 1964; 27: 493-515.
51 Sharma KN, Jacobs HL, Gopal V, Dua-Sharma S. J Neural Transm 1972; 33: 113-154.
52 Dreher B, Fukada Y, Rodieck RW. J Physiol 1976; 258: 433-452.
53 Liberman MC. Science 1982; 216: 1239-1241.
54 Liberman MC, Oliver ME. J Comp Neurol 1984; 223: 163-176.
55 Schneider GE. Science 1969; 163: 895-902.
56 Bullock TH, Ridgway SH. J Neurobiol 1972; 3: 79-99.
57 Bullock TH, Ridgway SH. In: Galler SR, Schmidt-Koenig K, Jacobs GJ, Belleville RE. Animal Orientation and Navigation. Washington, DC: NASA, U.S. Goverment Printing Office, 1972; 373-395.
58 Suga N. Philos Trans R Soc Lond B 1992; 336: 423-428.
59 Winter P, Funkenstein HH. Exp Brain Res 1973; 18: 489-504.
60 Margoliash D. J Neurosci 1983; 3: 1039-1057.
61 Margoliash D. J Neurosci 1986; 6: 1643-1661.
62 Benson PJ, Perrett DI. Perception 1994; 23: 75-93.
63 Perrett DI, May KA, Yoshikawa S. Nature 1994; 368: 239-242.
64 Wilson FA, Rolls ET. Exp Brain Res 1990; 80: 104-120.
65 Rolls ET, Tovee MJ, Purcell DG, Stewart AL, et al. Exp Brain Res 1994; 101: 473-484.
66 Nelsen JM. Agnosia, Apraxia, Aphasia. New York: Hoeber, 1946.
67 Sacks O. The Man Who Mistook His Wife For a Hat. New York: Alfred A. Knopf, 1986.
68 Damasio AR. Descartes' Error. Emotion, Reason, and the Human Brain. New York: G.P. Putnam's Sons, 1994.
69 Holst E von, St. Paul Uv. Naturwissenschaften 1960; 47: 409-422.
70 Strumwasser F, Cade TJ. Anat Rec 1957; 128: 630-631.
71 Wiersma CAG, Waterman TH, Bush BMH. Science 1961; 134: 1435.
72 Wiersma CAG. In: Wiersma CAG, ed. Invertebrate Nervous Systems, Their Significance for Mammalian Neurophysiology. Chicago, IL: University of Chicago, 1967; 269-284.
73 Wiersma CAG, Yamaguchi T. J Exp Biol 1967; 47: 409-431.
74 Lettvin JY, Maturana HR, McCulloch WS, Pitts WH. Proc Inst Radio Engr 1959; 47: 1940-1951.
75 Maturana HR, Lettvin JY, McCulloch WS, Pitts WH. J Gen Physiol 1960; 43: 129-175.
76 Lettvin JY, Maturana HR, Pitts WH, McCulloch WS. In: Rosenblith WA, ed. Sensory Communication. New York: MIT Press and Wiley, 1961.
77 Perrett DI, Smith PAJ, Mistlin AJ, Chitty AJ, et al. Behav Brain Res 1985; 16: 153-170.
78 Perrett DI, Harries MH, Bevan R, Thomas S, et al. J Exp Biol 1989; 146: 87-113.
79 Perrett DI, Oram MW, Harries MH, Bevan R, et al. Exp Brain Res 1991; 86: 159-173.
80 O'Mara SM, Rolls ET, Berthoz A, Kesner RP. J Neurosci 1994; 14: 6511-6523.
81 Barlow H. In: Gazzaniga MS, ed. The Cognitive Neurosciences. Cambridge, MA: A Bradford Book, MIT Press, 1995; 415-435.
82 Galambos R, Myers RE, Sheatz GC. Am J Physiol 1961; 200: 23-28.
83 Knudsen EI, Konishi M. Science 1978; 200: 795-797.
84 Knudsen EI. In: Cohen MJ, Strumwasser F, eds. Comparative Neurobiology: Modes of Communication in the Nervous System. New York: John Wiley and Sons, 1985; 93-104.