Read, Heather L. and Siegel, Ralph M. (1997) Modulation of Responses to Optic Flow in Area 7a by Retinotopic and Oculomotor Cues in Monkey Cerebral Cortex. vol 7 pp 647-661.
P.S. Goldman-Rakic, co-editor Cerebral Cortex
Yale University School of Medicine
C303. SHM
PO Box 3333
New Haven, CT 06510-8001
Modulation of Responses to Optic Flow in Area 7a by Retinotopic and Oculomotor Cues in Monkey
Heather L. Read* and Ralph M. Siegel**
Rutgers University
**Address correspondence to:
Ralph M. Siegel, Ph.D.
Center for Molecular and Behavioral Neuroscience
Rutgers University
197 University Avenue
Newark, New Jersey 07102
Phone: (201) 648-1080 x3261
Facsimile: (201) 648-1272
Email: axon@cortex.rutgers.edu
Current address:
Heather L. Read, Ph.D.
WM Keck Center for Integrative Neuroscience
University of California at San Francisco
513 Parnassus, HSE-834
San Francisco, CA 95143-0732
Phone: (415) 476-1762
Facsimile: (415) 502-6275
heather.read@phy.ucsf.edu
Abstract
Perception of two-and-three dimensional optic flow critically depends upon extrastriate cortices that are part of the "dorsal stream" for visual processing. Neurons in area 7a, a sub-region of the posterior parietal cortex, h ave a dual sensitivity to visual input and to eye position. The sensitivity and selectivity of area 7a neurons to three sensory cues were studied: optic flow, retinotopic stimulus position, and eye position. The visual response to optic flow was modulated by the retinotopic stimulus position and by the eye position in the orbit. The position dependence of the retinal and eye position modulation (i.e. gain field) were quantified by a quadratic regression model that allowed for linear or peaked receptive fi elds. A local maximum (or minimum) in both the retinotopic fields and the gain fields was observed suggesting that these sensory qualities are not necessarily linearly represented in area 7a. Neurons were also found that simply encoded the eye position in the absence of optic flow. The spatial tuning for the eye position signals upon stationary stimuli and optic flow was not the same suggesting multiple anatomical sources of the signals. These neurons can provide a substrate for spatial representation whi le primates move in the environment.
Introduction
In primates, the ability to distinguish the motion of objects or egocentric motion appears to be functionally linked to the process of touching, grasping or looking. A critical substrate for such visuo-spatial perception is the pos terior parietal cortex (Critchley, 1953). Visual, somatic and motor efferent copy signals, important for such cognitive operations, appear to converge in a different manner for each distinct subregion of posterior parietal cortex including areas 7a, 7b, and lateral intraparietal sulcus (LIP). It is the unique pattern of overlapping sensory input that may tell us the process carried out by a given cortical association area.
Based on the nature of converging visual and oculomotor sensitivities, it has been hypothesized that area 7a neurons can encode a spectrum of 1) fixed positions and 2) egocentric motion trajectories in space. Mountcastle and his collea gues observed a sub-population of area 7a neurons which responded preferentially to the axis and direction of visual motion relative to a fixation point in space (Motter and Mountcastle, 1981; Steinmetz et al., 1987; Motter et al., 1987). It was suggeste d that this population of neurons could predict the position of a moving object (or hand) with respect to the viewer. This hypothesis was supported by two additional observations. First, neurons in parietal cortex had discriminatory responses to "loo ming" and rotary type visual stimuli (Sakata et al., 1986; Sakata et al., 1980). Such visual cues are created naturally when the head (or body) moves about and they impart information about the direction of movement. Second, visual responses in 7a we re modulated by the eye position (Andersen et al., 1985b; Andersen et al., 1990). The observation of eye position dependent visual responses in parietal cortex was surprising because much of our understanding of physiologic mechanisms for visual perceptio n had dealt with observer independent retinotopic representations. It was soon recognized that eye and retinotopic position could be used in combination to predict a spectrum of fixed locations in space (Andersen et al., 1985b; Zipser and Andersen, 1988).
Recently, discriminatory responses to a third visuo-spatial signal, optic flow pattern, have been described for neurons in area 7a (Siegel and Read, 1997). Selective responses to simple optic flow patterns including rotary, radial motio n and axis of translation were found in area 7a (Siegel and Read, 1997). Optic flow information could be passed to area 7a via a projection from MST or LIP (Andersen et al., 1990; Boussaoud et al., 1990; Schaafsma et al., 1995). Accordingly, detection o f optic flow is impaired by lesions of the middle temporal area, called MT or V5 (Newsome and Pare, 1988; Andersen and Siegel, 1990). Hierarchical processing has been hypothesized to occur between MT and medial superior temporal cortex (MST) such that MT neurons respond selectively to direction of translation while neurons in MST respond selectively to more complex motion flows including rotary, radial, and spiral motion (Saito et al., 1986; Duffy and Wurtz, 1991; Orban et al., 1992; Graziano et al., 1994 ).
In the present study, we examine retinotopic and eye position influences on a population of area 7a neurons in which we have assessed optic flow pattern selectivities. Our aim was to quantitatively fit retinotopic and eye position rece ptive fields. Neurons in 7a had discriminatory responses to complex motion flow patterns similar to those reported in MST. In distinction to MST, there appears to be a prominent selectivity to the locus of the optic flow. Furthermore, responses to opti c flow are modulated by the eye position. Convergence of visual and extra-retinal signals occurs upon parietal neurons with optic flow pattern selectivity. These three sensory signals may be used to derive information about the location of the viewer re lative to objects in the environment.
These results were presented in abstract form (Siegel and Read, 1994).
Methods
Behavioral tasks and visual displays
Rhesus monkeys were trained to execute a reaction time task which required them to fixate a central point and pull a lever to initiate a trial. Two seconds after the trial was initiated, a visual display appeared on screen. Monk eys were required to release the lever upon detecting 1) a dimming of the fixation point or 2) a change in the optic flow. Correct responses were rewarded with juice. Eye position was monitored with an infrared video camera (ISCAN Co. Cambridge, Ma.) and trials were aborted if eye velocity indicated a saccade (greater than 50o/sec). Off-line analysis confirmed that the fixation was maintained within the range of + 1.5o of visual angle. Monkeys viewed displa ys while positioned 57 cm from an 85 cm VGA Mitsubishi 1301 monitor. Thus, the display area subtended 64o by 48o of visual angle in the horizontal and vertical axes, respectively.
Receptive field properties for up to three spatial parameters were characterized for each neuron. The display layouts used for testing these receptive field properties are illustrated in Figure 1. Figure 1A illustrates the test for sen sitivity to retinotopic position of a stationary square. Figure 1B illustrates the test for sensitivity to the position of the center of motion. Figure 1C illustrates the test for the effect of the angle of gaze while viewing an optic flow stimulus patt ern. Prior to executing the latter two tests, the selectivity for optic flow pattern was determined with the optic flow centered on the horizontal and vertical meridians. If the neuron was obviously selective for one type of optic flow, then that preferr ed optic flow pattern was used for subsequent tests. Figure 1D illustrates the test for effects of angle of gaze while viewing a stationary square at a fixed retinotopic position. Details of the display layouts are described in the legend of Figure 1. < /P>
Stationary squares, 5o or 10o in width, were presented while the animal attended to the dimming of a central fixation point (3o width). A stationary square of light was randoml y displayed at nine different positions on a 3 x 3 grid with a width of 35o or 40o which was centered over the horizontal and vertical meridians. The stimulus and background luminance were 32 cd/m2 and 0. 25 cd/m2, respectively.
Two dimensional structured motion displays were used to assess sensitivities to 1) optic flow; 2) fixation position (angle of gaze) and 3) center of motion position. These tests required the animal to attend and respond to a change of s tructured motion to unstructured motion and visa versa. Motion displays were created as described previously (Siegel and Andersen, 1990; Siegel and Read, 1997). In the present work, displays consisted of 128 points of 0.1o size; each point had a fixed point life of 532 msec (32 video frames). Translation, radial, planar rotation, and spiral optic flows were used. The point speed in the translation and radial motion displays was 6o of visual angle/sec; in the planar rotation displays, the rotation angular velocity was 60o/sec. The spiral stimuli were generated by vector addition of the above radial and the planar rotation stimuli. For all experiments involving optic flow stimuli the individual dis play diameters were 40o. An unstructured display was created from the test display by randomly displacing all the component motion trajectories within the display area (Siegel and Andersen, 1990; Siegel and Read, 1997). Optic flow patt ern transitions were smooth and occurred during the end of the point life for each point.
The standard display set contained 8 different optic flows including: 1) leftward and rightward rotation; 2) compression and expansion and 3) the four spiral patterns resulting from the vector summation of the rotation and expansion flo ws. A preliminary test of optic flow sensitivity to the pure motion patterns (rotation and expansion) was often carried out prior to testing for the full set which included all the spiral combinations. After the optic flow selectivity was determined, th e effect of the retinal locus and the angle of gaze was examined.
Surgical and Recording Procedures
Prior to the initial surgery, magnetic resonance images were collected to aid in the placement of recording chambers. At a later date, a platform of titanium screws (Synthes Co., Denver, Co.) and orthopedic bone cement (Palacos R, Smith+Nephew Co.) was surgically placed on each animal’s skull under general isoflurane induced anesthesia. A stainless steel post was embedded in the platform so that head position could be fixed and eye position could be monitored. Antibiotics were g iven pre- and post-operatively; scheduled doses of analgesics were given post-operatively. The skin around the platform was cleaned on a regular basis to promote healing and to prevent infection. After a two week recovery period, monkeys were habituated t o sitting in a custom designed chair with their heads restrained; then they were trained to fixate while performing reaction time behavioral tasks.
A second surgery was carried out to place a 16 mm inner diameter recording chamber over the posterior parietal cortex leaving the dura intact. Placement was guided using the magnetic resonance images. The stereotaxic coordinates for cha mber placement were 3 mm posterior to AP and 14 mm lateral for two recording hemispheres; in the third, the chamber was placed 20 mm lateral.
Extracellular unit recordings were made with 1.5 to 3 MW , glass coated platinum electrodes with a 10 to 40 m m tip width (Wolbarsht et al., 1960). Electrodes were placed daily within a dual circular coordinate system of the chamber and were lowered with an axial motion using a Kopf hydraulic microdrive directly through the dura. Chamber placement was anatomicall y confirmed with electrolytic lesions at the conclusion of the study.
Statistical Analysis
Analysis of variance: Analyses were carried out on data sets including five or more trials per stimulus condition. Typically eight to twelve trials were collected per stimulus condition. Significant changes in firing rat e with the display parameter and time period of the task were determined with a two-way analysis of variance (Siegel and Read, 1997). The display parameters could be retinotopic positions, the structures of optic flow, or the angles of gaze (Figure 1). Th e other independent parameter on the two-way analysis of variance was the window of time over which firing rate was measured. This procedure was used to make distinctions between sensitive and selective neural responses to a given parameter (Siegel and Re ad, 1997). The firing rate was computed for each trial and compared for two task times: 1) the 500 msec prior to stimulus onset and 2) the 500 msec after stimulus onset. Cells were categorized according to statistical significance. These categories were derived to test for the properties of (a) non-responsive to an characteristic of the stimuli, (b) responsive yet non-selective to the stimuli, and (c) responsive and selective to the stimuli (Siegel and Read, 1997) based on van Essen (1985). Neurons that were not modulated by the stimulus were termed non-responsive (TYPE 0) cells as they had no significant difference in firing rate with either the display onset or type. Non-selective (TYPE 1) cells had a si gnificant differences in firing rate between the two task times being compared (baseline and post-stimulus onset) but no significance associated with display type. Stimulus selective (TYPE 2) cells were those with significant differences in firing rate with stimulus onset and display type (or position for tests of retinotopic or fixation effects). A fourth type of response property can also be detected by this analysis method. These are cells for which the baseline rate of activity prior to the sti mulus onset varies with the stimulus condition. This is possible because certain tests given to the neuron required the animal to fixate at different locations on the screen. The dependency of the neural response on the fixation location (Andersen et al., 1985b) thus results in a baseline change in firing rate. For these particular cells the test visual stimulus given later in the trial does not alter the response of the neurons. These cells are termed putative fixation (TYPE 3) to indicated the fi xation position dependency. They did not have a significant effect associated with stimulus onset but did have a significant effect with stimulus type.
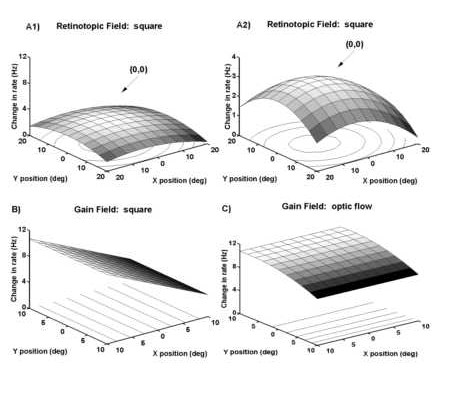
Regression model for response field data. In order to determine and quantify the dependency of the visual response on retinotopic or fixation position, regression methods were used with the dependent measure being the difference
in firing rate between the baseline firing rate and the driven response expressed in spikes per second or Hz. The model for the data was a linear modulation with horizontal and vertical positions, plus interaction and quadratic terms in either x or
y. The quadratic terms allowed for fitting of a local maximum or minimum in the data. Thus the most general model for fitting the response field was ![]() , where A is the neural activity in spikes per s
econd. The terms Rx and Ry were the horizontal and vertical retinotopic (or eye) positions, respectively. The regression coefficients, ax and ay are the slopes of the regression in the horizontal and vertical dimensions, respe
ctively. The horizontal-vertical interaction term is axy and the quadratic terms are axx and ayy. The terms b is the intercept. The error term
, where A is the neural activity in spikes per s
econd. The terms Rx and Ry were the horizontal and vertical retinotopic (or eye) positions, respectively. The regression coefficients, ax and ay are the slopes of the regression in the horizontal and vertical dimensions, respe
ctively. The horizontal-vertical interaction term is axy and the quadratic terms are axx and ayy. The terms b is the intercept. The error term ![]() is the residual given by the difference o
f the predicted value and the actual value for the ith measurement. The a and b parameters were fit using linear regression by a stepwise procedure to introduce and remove variables at the P=0.05 level (GLM Procedure, SAS
Co., Durham, NC).
is the residual given by the difference o
f the predicted value and the actual value for the ith measurement. The a and b parameters were fit using linear regression by a stepwise procedure to introduce and remove variables at the P=0.05 level (GLM Procedure, SAS
Co., Durham, NC).
With the six degrees of freedom (i.e. six coefficients), there could be concern that the P=0.05 level of significance in not rigorous. In a standard regression method, this could be a problem because some terms could erroneously account for variance in the model and result in altered values for the truly significant terms. A simple example of this problem would be fitting a model of y=ax+b to data whose actual underlying model was y=ax. Depending on the level of noi se in the measurements of y, the intercept coefficient b could be non-zero. The "true" value of the slope a would thus be incorrect, albeit by a small amount in this simple example. In our non-linear model with six terms, th is propagation of error into the estimated coefficients becomes amplified if a standard regression analysis is used. However, the stepwise regression procedure is chosen specifically to circumvent this problem. The stepwise methods works by leaving only the coefficients that are significant in the final model of the data. A test of significance is done for every term that is entered or removed from the model. If the term is not significant, then it is removed. If another term enters so that a pre-e xisting term becomes non-significant, the pre-existing term is removed. Typically two to four iterations occur before the model converges; the models typically have an intercept and two or three significant terms. The statistical computations provided sum s of squares, errors, and adjusted significance values for all significant coefficients. Using this method, a significance level of P=0.05 is well justified; quite often the parameters are significant at the P<0.01 level.
An additional model was used for comparisons of the effects of fixation or stimulus position with stimulus type. In these cases, the data for two stimulus types were collected in two different blocks. The activity was given as the lin ear model with the additional categorical variable, stimulus type or "S". The general model is:
![]()
where "S" can take a value of "S(0)" or "S(1)". If all the "C" parameters are "0", then both stimuli result in the same shape receptive field. If any of the "C" parameters ar e significant, then the two stimuli result in different receptive field shapes. This model complete with categorical variables was fit using the GLM procedure of the SAS Co.
Histological analysis. At the conclusion of the recording studies, the animals were sacrificed with an overdose of barbiturate and perfused intracardially (Siegel and Read, 1997). Pins were inserted at known chamber coordinates a nd a map of penetrations was reconstructed relative to these markers. All procedures were performed in accordance with NIH guidelines on the use of animals in research and were approved by the Rockefeller University and Rutgers University Animal Use Care Committees.
Results
A total of 577 neurons were recorded from the entire chamber areas in three hemispheres of two monkeys. Thirty percent of the 577 neurons did not respond to any of the visual stimuli employed and were subsequently removed from stati stical analysis. The neurons described in this study are collected from the same hemispheres as described in Siegel and Read, 1997.
Receptive Fields: Stationary Square Response Properties
Receptive field tests were completed on 293 neurons. These tests were used to verify that our population of neurons was similar to those in other published studies (Motter and Mountcastle, 1981, Andersen et al, 1985, Andersen et al., 1990). The response to a stationary square flashed stimulus was first examined (Figure 1A). Stationary squares were flashed for 1 sec at positions in a 3x3 grid. The two way analysis-of-variance was used to categorize the neurons as visually respons ive, and/or selective to the flashed bars. Roughly 50% (142/293) of the cells tested were responsive to the stationary square stimulus. Area 7a neurons are known to have large receptive fields. We thus tested for the receptive field for a uniform response in the 40x40o region with the two-way analysis of variance. Thirty percent (81/293) of the neurons tested had non-uniform receptive fields for stationary squares of light (as indicated by a TYPE 2 measure in the analysis of variance; see Figur e 2). Twenty percent had a uniform response across the visual test area (TYPE 1). Neurons that responded to the stimuli without any dependence on the location of the stimulus (TYPE 1) can be regarded as having an omni-positional response, i.e. activation regardless of the stimulus location. This is likely due to the receptive field being larger than the 40x40o region tested (Motter and Mountcastle, 1981). Neurons that showed some spatial selectivity over the tested region of visual space were s ubject to further analysis in order to determine the shape of the receptive field.
Receptive field size and shape Of the 81 neurons that showed spatial selectivity to the position of the stationary visual stimuli, 72 had a significant fit to the regression model described in Methods. Examples of a peaked fit to a flashed square may be found in Figures 10A and 11A. The remaining 9 neurons could not be significantly fit using the model (i.e. a general linear model better accounted for the variance). Data from 33% of the 72 neurons (27/72) were fit with linear co mponents in the horizontal (ax) and/or vertical (ay) axes. Sixteen percent (13/72) were fit with a significant interaction term (axy). Forty percent (n=32/72) of the neurons had a peak or trough in the response field as indicated by a significant quadratic term in the horizontal (axx) and/or vertical (ayy) axes. Thus, the present model described a spectrum of retinotopic response fields encountered in area 7a. The peaked receptive field shapes describe here are consiste nt with prior work (Motter and Mountcastle, 1981, Andersen et al., 1985, Andersen et al., 1990); the quantification of the receptive field shapes over the 40x40o test region is a novel finding in this report.
Fitting of the retinotopic field data with the regression model allowed for quantification of asymmetries in horizontal or vertical light sensitivities. In early studies, it had been reported that these neurons were 1) primarily foveal sparing (Motter and Mountcastle, 1981) or 2) that they had peaked receptive fields (Andersen et al., 1985); however these data were not quantified. The need for a quadratic component in 40% of the fits reflected the presence of local maximum or minimum in the response fields and these curvilinear fits included examples of foveal sparing (e.g. Figure 7) and local optima (e.g. Figure 11). Neither foveal sparing nor peaked receptive fields were the exclusive receptive field type. The receptive field typicall y spanned the test area in one or both axes (i.e. horizontal and vertical). The only discernible or systematic asymmetry in the receptive field shape was a greater sensitivity to light within the visual hemifield contralateral to the recorded hemisphere as reported previously (Motter and Mountcastle, 1981). This asymmetry was evident when the horizontal coefficients from one hemisphere was adjusted by multiplying by -1 so that all positive horizontal coefficients were on the contralateral hemifield. A pl ot of the adjusted horizontal and vertical coefficients for response field model illustrates the preponderance of light sensitivity in the contralateral visual field (gray circles in Figure 3A). The bias to contralateral fields is also evident in Figure 3 C in which the distribution of the horizontal slopes for static squares is presented. The distribution is skewed to the contralateral field.
Structured motion selectivity
If area 7a is indeed associated with analysis of space using motion cues, then it would be expected that its neurons represent optic flow. Neurons of area 7a have been tested for optic flow selectivity with drifting bars (Motter and Mountcastle, 1981) or by fields of moving dots (Siegel and Read, 1997). This optic flow could be derived from neurons that respond to similar neurons in area MST (Duffy, Wurtz, 1991, Lagae et al., 1994, Graziano et al., 1994). A detailed description of the sensitivity of these neurons to pure component motion has been given previously (Siegel and Read, 1997). The population of neurons reported here was selective to the same optic flows as in MST as determined using translation, radial, and planar rotation stimuli, however the tuning of the area 7a neurons is different from that of MST neurons (Siegel and Read, 1997). A known property of area MST neurons is their selectivity to combinations of optic flow, e.g. spiral motion. The response of area 7a neurons to spiral motions formed by the vector addition of radial and planar rotation was thus examined. Neurons in area 7a responded robustly and selectively to mixed co mponent motion. The selectivity to spiral motion is described in two steps. First, the population of neurons that responded selectively to optic flow is delimited. Then its selectivity to spiral motions is described.
Roughly half (197/357) of the neurons tested responded in some way to the onset of unstructured or structured motion ("SFM", TYPE 1 or 2, Figure 2). About half of the neurons that were tested for the onset of structured motion (66/197) responded preferentially to some subset of optic flows (i.e. TYPE 2). The neuron of Figure 4A increased its firing rate in response to expansion, but not compression, rotation or spiral type motion. The responses of one "spiral" motion selectiv e neuron are shown in Figures 4B and 5. In the first block of optic flow patterns tested, this neuron responded robustly to the onset of spiraling counterclockwise compression motion (bottom histogram of Figure 4B) and minimally to the onset of the four pure component motion patterns (i.e. top four histograms). The neuron also responded minimally to the spiraling clockwise compression motion (Figure 4B, fifth histogram). A second block of test stimuli included four spiral combinations of rotation and r adial motion (Figure 5A). Again, this neuron responded more robustly to counterclockwise compression spirals than to other spiral combinations tested (Figure 5A). An additional means of testing for degree of structure selectivity was to compare responses elicited with the conventional display transition order (structured optic flow changing to unstructured optic flow) to those elicited with the reversed order of transition (unstructured motion to structured motion). In this manner, non-specific response s to visual display onset were separated from those which were specific for full field stimulus structure (Siegel and Read, 1997). The neuron responded most robustly to the onset of counterclockwise compression motion regardless of the transition order (F igure 5B, second histogram). Minimal responses were elicited in the 500 msec following the onset (dotted line) of unstructured motion (Figure 5B, bottom two histograms). Furthermore, a late response associated with the onset of counterclockwise compress ion motion was observed (Figure 5B, arrow). Thus, neurons in area 7a were selective not only to pure motion stimuli but also to the multi-component spiral flow as observed for neurons in MST (Graziano et al., 1994).
Though selectivity for a single flow pattern was observed, most area 7a neurons responded to more than one direction (e.g. compression and expansion sensitive, but rotation insensitive) or type of optic flow (e.g. compression and rotati on). An example of a response selectivity to type (rotation) but not direction (counterclockwise versus clockwise) is shown in Figure 7.
The cortical sites with neurons selective for optic flow or motion direction were largely overlapping with those sites yielding neurons sensitive to stationary flashes of light. The recording sites with selective responses to motion in general (optic flow or direction of movement of a square) were mapped on the left in Figure 6 (A, C and E). Sites with selective responses to 1) retinotopic position (squares) or 2) optic flow (circles) were mapped on the right in Figure 6B, D and F. Rec ordings in this paper were all taken from the upper few millimeters of cortex and thus were in area 7a. Note that the majority of sites which were selective for luminance position were also selective for optic flow pattern. However some sites which were tested for sensitivity to both stimulus types responded solely to optic flow or stationary stimuli.
There are two recording sites apparently in the superior parietal gyrus in one hemisphere that contain visual neurons (Figure 6A). These sites could not be verified histologically by the presence of lesions. Furthermore other superior p arietal sites in another hemisphere were not visually responsive. Given the dearth of published data as to the presence of visual neurons in the superior parietal lobe, it is possible that these sites arose from penetrations in which the electrode path wa s not straight. The cells at these two locations were not distinguishable from other visual neurons described in this study. However the possibility of visual activity in the superior parietal gyrus cannot be fully ruled out.
Retinotopic location of optic flow
We tested the possibility that these neurons were sensitive to retinotopic displacement of behaviorally salient motion stimuli from the point of fixation. Animals were trained to fixate centrally, while viewing random dot struct ured motion displays centered at 9 different positions on a 3x3 grid with a step of 10o. Random dot display diameters were generally 40o; though similar retinotopic fields were obtained with small diameter (10 o) displays (not shown). The behavioral task for mapping retinotopic sensitivity to structured motion displays differed from that used to determine the response field for a stationary square in that the animal was required to respond to a c hange in stimulus for a juice reward. The moving random dot stimuli was initially structured and became unstructured. Thus, the task forced animals to attend to various loci within the visual field while fixating a central point.
Responses to random dot structured motion displays were greatly modulated by the retinotopic position. In this respect, neurons of area 7a differed from those observed in MST which in general showed little variation with small (5 to 10< FONT SIZE=1>o) display displacements (Saito et al., 1986; Duffy and Wurtz, 1991; Graziano et al., 1994; Lagae et al., 1994). In the first example, the location of optic flow was shifted 10o leading t o a substantial decrease in neural activity elicited with rotation (black histogram in Figure 7B).
Figure 8 illustrates two examples of the test paradigm described in Figure 1B where retinotopic response fields for structured motion were mapped with a displacement step of 10o. The neuron in Figures 8A and 8B resp onded preferentially to expansion. The increase in firing rate associated with onset of expansion motion was greater when the center of motion was located in the central to upper right quadrant of the test area (Figure 8A). The preference for stimulus pos ition in the upper right quadrant was reflected in the slope of the response field fit which increased positively in both X and Y (P(ax)=0.001 and P(ay)=0.01; Figure 8B). The large response variation with horizontal displacement was reflecte d in a significant quadratic component to the fit giving the response field a parabolic shape or "peak" in the center (Figure 8B, P(axx)=0.02). The center of motion field depicted in Figure 8C and 8D comes from a neuron that responded pre ferentially to compression motion. This neuron had a broad retinotopic response field with robust responses spanning the test area in both horizontal and vertical axes (Figure 8C). Minimal responses were observed for stimuli located in the lower left quad rant (-10o,-10o) and the responses increased linearly with shifts in stimulus position upward and to the right as shown in the fit of the data (Figure 8D).
Thirty-seven percent of the neurons tested for retinotopic effects using optic flow stimuli had a significant position dependence. Of the fifty six neurons successfully tested for both optic flow selectivity and retinotopic position dep endence, 75% (41 cells) responded significantly to optic flow at multiple positions. Half of these neurons (21) were selective with respect to position (TYPE 2). The remaining 20 neurons responded equally well at all nine positions (TYPE 1).
The data for neurons with significant position effects (TYPE 2) were subsequently fit with the regression model. Most of these neurons were well fit by the model (18/21). Eleven of these neurons had response fields with linear dependenc ies on position. A third of the response fields had a local maximum or minimum as indicated by the presence of a quadratic component (7/21). The observation of local maximums and minimums in the response fields was surprising in that these motion display s were considerably larger (diameter of 40o) than the displacements (10o) used for testing position effects. As shown in Figure 8C, a 10o shift in display center from (0o,-10o) to (10o,-10 o) resulted in a dramatic shift in the visual response and yet there was more than 50% overlap in the retinotopic area stimulated under both conditions. These results suggest that the retinal locus of the optic flow will alter the response of a rea 7a neurons. The distribution of the horizontal and vertical slopes for the modeled data indicate that the bulk of the responses were to the contralateral visual field (black circles in Figure 3A).
There are two possible underlying simple mechanisms for the modulation of the response with the location of the optic flow field. The first is that there is a small region (e.g. 5o) of the visual field that is motion tuned. A ccording to this hypothesized model the position dependence of the response is due to a sub-regional motion selectivity. If this is the underlying mechanism, the selectivity to the optic flow stimuli should vary as a function of its position.
The optic flow selectivity was position invariant (Figures 7 and 8). In Figure 7, the mean firing rates for four different optic flow stimuli were reduced when the display was displaced 10o degrees up and 10o to the right of the fixation (see white versus black histograms in Figure 7B). However, the neuron responded preferentially to the two rotating optic flows at both retinotopic positions. Note that the effect of position on the response to a stationary square (Figures 7A) of light was maximal over the fovea and was weaker at (10,10o). This is quite different than the response observed with the optic flow pattern (Figure 7B). This point is further made in Figure 9, in which respo nses to two optic flows were compared over the nine different retinotopic positions. For this neuron, counterclockwise spirals elicited a more robust response than clockwise spirals at all positions. The directional selectivity does not depend on the loca tion of the stimulus. Hence, these results are inconsistent with the hypothesis that a local directional translation patch underlying the position selectivity.
A second hypothesis for the positional modulation of the response to the optic flow stimulus is that it is simply a shift of the stimuli in and out of luminance responsive regions in the neuron’s classic receptive field. The clas sic receptive field in this case would be that given by a static square stimulus. To test this possibility, the response of the neuron was measured when either static or optic flow stimuli were presented. Under the luminance hypothesis, the receptive fiel d shape should be the same using static stimuli and optic flow stimuli. A model for the modulation of response as a function of stimulus position and of stimulus types (categorical general linear model, see Methods) was computed for 28 neurons. Over half of these retinotopic response fields significantly varied as a function of stimulus type (S, see Methods) indicating that the receptive field is different under the two stimulus conditions. These results, taken with the maintained optic flow selec tivity as a function of stimulus position, are suggestive that the selectivity to the retinotopic position of the optic flow obtained in area 7a reflects a true encoding of the location of the optic flow field.
Gaze fields and gain fields: dependence of visual response on eye position
The dependence of the firing rate on the eye position (i.e. the "angle of gaze") was assessed with a behavioral task similar to those used previously (Andersen et al., 1985b; Andersen et al ., 1987; Siegel and Read, 1997). A neuron’s "luminance" receptive field was first mapped as illustrated in Figure 1A. Then a visual display was shown in a fixed retinotopic position within the neuron’s light receptive area. Fixation was varied o ver 9 different positions within a 30o by 30o region (Figure 1C). Animals fixated a given position at least 1200 msec before a visual display appeared within the neuron’s receptive field. The effects of eye positio n on the background firing rate and the visually driven response were quantitatively determined. Overall, 33 (25%) of the 131 neurons tested showed modulation of the background firing rate and 37 (30%) showed modulation of the visual response by eye posit ion. The remaining did not show any eye position related effects. The effect of eye position on the background rate will be called a "gaze field effect" and the effect on the visual response will be called a "gain field" effect in acc ordance with prior terminology (Andersen et al., 1985b; Andersen et al., 1990).
Stationary stimuli: The neuron in Figures 10A and 11A responded best to a stationary square centered over the point of fixation. (Figure 10 illustrates the peri-stimulus time histograms while Figure 11 provides the estimated mode ls for the same neuron, see below). The fit to the data indicated a peaked receptive field (Figure 11A). Prior work indicated that the response to retinotopically identical visual stimuli is altered as a function of the eye position in the orbit (Andersen et al., 1985). This result was essentially confirmed in the present study. When the fixation point was varied across nine different locations and the square was kept in the same retinotopic location, the visual response was greater for fixations in the l eft or contralateral hemifield (Figures 10B, 11B). The two-way analysis-of-variance was used to determine the proportion of neurons that solely depended upon the position of the eye in the orbit. These would be putative fixation neurons with a sign ificant effect of stimulus class alone and no effect of stimulus onset (TYPE 3). Of the 100 neurons tested for the modulatory effect of eye position on the visual response, 17 showed a significant effect of eye position alone (gaze field or TYPE 3) . The analysis-of-variance was also used to determine the proportion of neurons that only depended on the stimulus onset and not upon the eye position (TYPE 1). Twelve percent showed an effect of the visual stimulus onset alone. Lastly the analysis-of-var iance was used to determine the neurons which depended on both stimulus onset and eye position (TYPE 2). These 24 neurons showed an effect of eye position modulation upon the visual response (gain field) essentially confirming Andersen et al. (1985 ).
The firing rate’s dependence on horizontal and vertical eye position was quantified with a stepwise linear regression analysis for the 24 neurons with significant gain fields (TYPE 2). Gain field fits were generated by fir
st computing the change in firing rate in the 500 msec prior to stimulus onset versus the 500 msec after stimulus onset for each trial. The "change in firing rate" data was in turn fit with the regression model given in the Methods. For exampl
e the neuron in Figure 10B was associated with a significant "gain" in response to a stationary square of light when the angle of gaze was to the left visual hemifield. Accordingly, the gain field fit of the data had a significant horizo
ntal coefficient term (P(ax)=0.0001, Figure 11B). One third of the 24 neurons were fit with simple linear functions (some form of ![]() ). The study of Andersen et al. (1985) is extended in that many
neurons have now been shown to have an interaction and quadratic dependence accounting for the significant lack of linear fit in the earlier work. Forty-five percent of the 24 neurons had peaked gain fields since quadratic terms (
). The study of Andersen et al. (1985) is extended in that many
neurons have now been shown to have an interaction and quadratic dependence accounting for the significant lack of linear fit in the earlier work. Forty-five percent of the 24 neurons had peaked gain fields since quadratic terms (![]() ) were significant in the regression. An additional 7 neurons (30%) were not fit by the regression model (i.e. a general linear model accounted for the variance). Thus, the range of possible angle of gaze gain fields desc
ribed previously for area 7a was confirmed and extended to include non-linear fields with local maximum or minimum.
) were significant in the regression. An additional 7 neurons (30%) were not fit by the regression model (i.e. a general linear model accounted for the variance). Thus, the range of possible angle of gaze gain fields desc
ribed previously for area 7a was confirmed and extended to include non-linear fields with local maximum or minimum.
Optic flow stimuli: Prior studies have not examined whether or not eye position can alter the response to optic flow stimuli. The cell of Figures 10 and 11 was also tested for eye position modulation of the visual response to opt ic flow stimuli centered over the fixation point. This cell optimally responded to clockwise rotation. There was a difference in the visual response when the eyes fixated positions in the upper versus lower visual fields (Figures 10C and 11C) with the optic flow held at the retinal position (0,0o). The two-way analysis-of-variance was used to determine the proportion of neurons solely modified by eye position (TYPE 3), by visual stimuli (TYPE 1), and by both (TYPE 2) following the reason ing used with the stationary stimuli. Of the 50 neurons tested for the modulatory effect of eye position on the visual response, 12% showed an effect of eye position alone (TYPE 3), 24% showed an effect of the visual stimulus onset but no effect of eye po sition (TYPE 1), and 30% showed an effect of eye position and visual stimulus onset (TYPE 2).
Regression was used to quantify the modulation of the visual response by eye position (i.e. gain fields) by evaluating the change in firing rate 500 msec before and after stimulus onset. There was a linear eye position effect for many neurons with a smaller number showing peaked gain fields. (44% linear only, 28% quadratic of 18 neurons). Clearly the angle-of-gaze effect on visual stimuli in area 7a can be extended to include effects on optic flow.
The proportion of eye position modulated neurons is similar within the luminance and optic field tests. The question arises as to whether the modulation of the static or optic visual responses by eye position is derived from a common ey e position signal. A possible model would be a single neuron with two different visual inputs (static and motion) and a single modulatory eye position signal. One necessary condition for such a model would be that the gain field should be the same for the static and optic flow stimuli. The gain fields were thus compared on a neuron by neuron basis.
Comparison of modulation of static and optic flow stimulation. Nineteen cells were maintained long enough to test the effects of eye position on both stationary and optic flow stimuli. Neurons were found as in Figures 10 and 11, in which the gain field with stationary visual stimuli was different from that with optic flow stimuli. The neuron had a linear eye position modulation when tested with the static square and a weakly quadratic modulation when tested by optic flow. The qualitative impressions obtained by inspection were quantified using a method in which a single model was fit to the data obtained using static and optic flow stimuli.
A general linear model with a categorical variable for stimulus type (i.e. static versus optic flow, see Methods) was used to model the gain fields. Ten of the 19 (50%) neurons had significant (P<0.05) interaction terms for the cate gorical term of stimulus type (S) and the eye position term. For example, the data shown in Figure 11B and 11C had a significant interaction between the stimulus type and the eye position in the horizontal direction (p < .0001). This neuron’s r esponse to a static square was modulated in the horizontal axis (Figure 11B). In contrast, the same neuron’s response to optic flow was only modulated in the vertical axis by eye position (Figure 11C). This differential effect of "stimulus typ e" on the eye position modulation is what gave rise to the significant interaction term. Seven of the 19 (45%) neurons had similar eye position fields for both stimuli and no significant effect of stimulus type. The remaining two neurons were not sig nificantly modulated by any of the variables considered. The observed effect of stimulus type on the gain field shape indicates that the modulatory effect of eye position can depend on the visual stimulus. For these neurons, it seems that there ma y be different mechanisms responsible for the eye position modulation of the visual response to static stimuli and to optic flow stimuli. The distribution of the horizontal and vertical coefficients indicates that there is a broad distribution of eye posi tion modulation in these neurons (Figure 3B). When the angle of gaze effect was considered for the population as a whole there was a tendency for the gain fields to lie towards the contralateral field (Figure 3C).
Fixation dependence of visual response For 59 (45%) of the 131 neurons tested, there was an effect of eye position on the baseline firing 500 msec prior to stimulus onset. For example, the neuron in Figure 12A encoded eye positio n prior to the stimulus onset in that it fired at 35 and 15 Hz when the animal fixated positions of (-10o,10o) and (10o,-10o), respectively. The firing rate for the 500 msec p rior to stimulus onset was quantified using regression analysis. A group of 22 of the 59 neurons analyzed had linear effects of eye position, with 5 of these showing significant linear interactions. The 37% value for area 7a compares well with that of And ersen et al. (1990) in which 30% (19/65) were shown to be linear in area 7a and LIP. In the earlier study, no further effort was made to categorize the nature of the statistically significant lack of fit for 70% of the neurons. In the present work, it was found that 17 neurons (28%) contained statistically significant quadratic terms (peaks). (This percentage is different from the qualitative observation in the earlier study that only 2 neurons showed peaks; the difference in the two studies may be attrib uted to the classification of neurons with a linear component and a significant lack of fit to the group of neurons termed "linear"). Finally the remaining 20 (30%) of the neurons were not fit by the linear plus quadratic model. Such neurons hav e peculiar and complicated receptive fields which will require further work to identify an appropriate model.
Eye position measurement
As noted in the Methods, the eye position was recorded with an infra-red video system. Two examples of eye position data illustrate that fixation was indeed maintained throughout the visual presentation (Figure 13). This neuron’ s activity is strongly modulated as a function of the fixation position. At the onset of the stimulus onset, eye position remains constant. At the position (-10,0o) the visual stimulus onset leads to an inhibition of the extant fixation respons e. Thus the effects of eye position upon the response of the neuron cannot be attributed to systematic variations in eye position correlated with stimuli. Similar eye position measurements were obtained with all neurons.
Discussion
Optic flow selectivity and retinotopic sensitivity
Prior physiological studies in area 7a of the behaving monkey suggest that representation of surrounding extrapersonal space is developed from a combination of visual and oculomotor signals (Andersen et al., 1985a; Andersen et al., 1990). Optic flow is an additional cue that is represented in area 7a (Siegel and Read, 1997). A large percentage of neurons in area 7a are sensitive to the onset of optical flow and about half of these can distinguish amongst different types of optic flo w. The present work extends these observations by demonstrating that not only do area 7a neurons respond to "pure" optic flows of translation, planar rotation, and radial motion, but some neurons are specifically and clearly tuned to combinations of these flows (e.g. "spiral selective" neurons). Thus, the range of optic flow pattern selectivities observed in area 7a encompasses (and probably reflects) those selectivities observed in area MST (Duffy and Wurtz, 1991; Graziano et al., 1994; Lagae et al., 1994). Such a distributed coding of optic flow should be useful for determining the direction of heading during complicated egocentric trajectories.
Two models of visual navigation based on optic flow signals could be applied to the observed properties of area 7a neurons. The first model envisions a ‘library’ of broadly tuned set of neurons similar to those encountered in areas MT, MST and 7a which are matched with the "on-line" optic flow pattern to determine heading direction (Perrone and Stone, 1994). The selectivities to pure component and complex optic flow patterns observed in MST and area 7a could provide such a l ibrary; however, neurons from both regions generally have a graded response to sub-optimal flow patterns and are selective for more than one optic flow pattern. It is more likely that the "coding" for optic flow pattern does not occur by a match ing between the visual array and the neurons tuning but instead is distributed across the population of neurons in MST and area 7a. The second model assumes that the optic flow pattern selectivities arise from ‘on-line’ processing of optic flow (Lappe et al., 1996). Furthermore the model of Lappe et al., (1996) predicts that selectivities will systematically flip when retinotopic position of the center of motion falls outside the primary luminance field. Indeed, for both of these models the retinotopic locus for the center of optic flow is an essential signal for determining the direction of self motion (Perrone and Stone, 1994; Lappe et al., 1996).
The results from the present study suggests that some amalgam of the two models described above may be suitable for describing the process going in area 7a. Responses of area 7a neurons varied with the center of the optic flow in retin otopic coordinates as predicted in both models. Displacement of these displays by as little as 10o greatly modulated the response of neurons to a given optic flow. Similar position effects in MST have been attributed to 1) sub-optimal activatio n of ‘local fields’ or 2) receptive field borders for luminance contrast (Duffy and Wurtz, 1991; Graziano et al., 1994; Perrone and Stone, 1994). In the present study, selectivities for a given optic flow remained constant regardless of retinotopic positi on. Hence the position effects could not be attributed to "local field" selectivities as hypothesized in the "mosaic" hypothesis (Duffy and Wurtz, 1991). According to a proposed model for spatial navigation, a neuron’s selectivity for direction of optic flow would flip once the center of motion pattern fell outside the region of optimal activation with static luminance (Lappe et al., 1996). We observed no statistical or qualitative correlation between the receptive fields for static luminance (a square) and center for optic flow in area 7a, as one would predict from such a model. However, as indicated by Lappe et al. (1996), such flips may require a twofold larger test area then that used in the present study. Finally, preliminary studies of shifts in optic flow center within a single full-field stimuli support the conclusion that area 7a neurons are tuned for the center of optic flow in the absence of luminance cues associated with the borders of the optic flow stimuli (McCollum and Siegel, 1996). Thus, some area 7a neurons have a dual selectivity to optic flow and the center of the flow that is commensurate with its proposed role in spatial navigation. These results are also consistent with the thesis that area 7a plays a role i n disambiguating a moving object’s position in the environment.
Optic flow selectivities and convergent effects of eye position
Two apparently distinct oculomotor signals were observed for area 7a neurons. The first, is the "fixation" effect which refers to the effect of fixation position on firing rate prior to the onset of a visual stimulus. The "gaze fields" quantified in the present study were similar to those described previously (Andersen et al., 1985a; Andersen et al., 1990) with the proviso that many had a quadratic dependence on eye position.
The second oculomotor signal observed in area 7a was "gain field" effect which refers to the effects of fixation position on responses to a visual stimulus (Andersen et al., 1985a). Gain fields were determined fo r two visual stimulus types: a stationary square and an optic flow stimulus. Independent of stimulus type, most neurons were found to have a linear modulation of the visual response by eye position. However a full third of the neurons required a quadrati c component to account for local peak and may account for a subset of angle of gaze effects reported previously (Andersen et al., 1985a; Andersen et al., 1990). Given that some of the angle of gaze gain fields were not linear, it remains to be seen whether a simple multiplicative interaction exists between the retinotopic tuning and the fixation position or whether this signal interaction is more complicated.
The "gain field" effects are sometimes associated with complementary "fixation" signals (e.g. Figure 12). In such cases, the modulation of driven activity with eye position is still a true gain effect and not a simp le additive effect. Hence, the "fixation" and "gain" effects could arise from independent sources. Likely sources for the eye position sensitivity in area 7a include the pulvinar (Robinson et al., 1990; Robinson, 1992) and cortico-co rtical inputs from LIP (Andersen et al., 1990) or even feedback from the frontal eye fields (Cavada and Goldman-Rakic, 1989).
An interesting and novel finding in the present study is the convergence and interaction between mechanisms for extraction of optic flow pattern and angle of gaze. First, neurons in area 7a which are selecti ve for optic flow pattern are also affected by the angle of gaze. Thus, the two sensory parameters converge on a single population. Second, the angle of gaze gain field varies with the visual display type or pattern raising the possibility that th ese two parameters interact. Spatial navigation models as of yet have only considered extraction of heading direction from optic flow patterns with a fixed fixation angle.
Models which employ nonlinear (sigmoidal) gaze fields and Gaussian receptive fields to extract spatial location (Zipser and Andersen, 1988; Pouget and Sejnowski, 1994; Salinas and Abbot, 1995) and direction of self-movement (Lapp e et al., 1996) are consistent with the present results. Information about direction of body (head) movement and movement in the visual scene can be extracted from the optic flow (Lappe et al., 1996; Perrone and Stone, 1994; Duffy and Wurtz, 1991). Monke y and human psychophysical thresholds for detection of two-and-three dimension optic flow are similar, suggesting similar cortical mechanisms for extraction of optic flow (Siegel and Andersen, 1988; Siegel and Andersen, 1990). Given the present results an d the fact that multiple fixation positions are necessarily involved in spatial navigation, it seems that more complete models will have to be developed perhaps using different principles that incorporate memory for multiple fixation sites in time.
Perhaps the most novel results of the current work are that both the retinotopic receptive field and the angle of gaze fields of area 7a neurons can depend on the type of visual stimulus being used. There are two possible reasons for th is. First, there is a difference in total luminance between the static bars and the optic flow stimuli. However, this would only be expected to change the strength of the response and not the spatial tuning.
A second reason is that the two stimuli had different saliency. When the visual test stimulus was a static square stimulus, the monkey only attended to the red fixation point. When the visual test stimulus was an optic flow stimulus, th e monkey had to detect changes from structured to unstructured motion while maintaining fixation of the red point. The monkey could anticipate which stimulus group he was viewing as these stimuli were presented in blocks. Thus the monkey’s cognitive state could thus be modulating the spatial representation in area 7a. The saliency or selective attentional effect may be similar to that initially presented by Bushnell et al. (1981) in parietal lobule and reported by others (Fischer and Boch, 1985; Connor et al., 1996; Duhamel et al., 1992). Preliminary work using static stimuli further supports the modulation of the receptive field shape by the stimulus saliency (Quraishi and Siegel, 1997).
The saliency or attentional modulation of the spatial representation would occur across the population of neurons in area 7a resulting in a different population of neurons sending signals onto subsequent cortices (e.g. prefrontal) as a function of the saliency of the stimuli. In order for the subsequent cortices to "interpret" the population response, the subsequent cortices would also need to have information as to the saliency of the stimulus. This saliency could change duri ng the trial leading to dynamic changes in the population response.
The question then arises as to why there should be spatial changes in the receptive field and the angle-of-gaze signals with attention or stimulus saliency. Such an effect may prove useful for directing or redirecting the focus of atten tion or gaze (Steinmetz et al., 1994). One possibility to be explored in future work is that the optic flow stimuli is providing specific spatial information about possible behavioral targets and could serve as a step in the transformation from sensory to motor coordinates. Experiments in which the monkey used information derived from optic flow to guide different motor behaviors might therefore increase the magnitude of these effects and provide a more direct handle as to the underlying mechanisms.
In conclusion, we have found that optic flow selectivities exist in area 7a. These selectivities most likely arise from anatomical connections with MST, although other sources are possible. These optic flow selective neurons are also mo dulated by the angle of gaze and retinotopic position. The receptive field shape and the eye position modulation of visual responses depends on the visual stimulus. These properties of posterior parietal neurons could be crucial for encoding spatial posit ion and may underlie spatial navigation while at rest and while in motion.
Acknowledgments: Torsten Wiesel’s helpful discussions in the early stages of this work are gratefully acknowledged as is the use of his laboratory at The Rockefeller University. Kathleen Anderson is thanked for her discussion of, participation in, and careful reading of this study. We thank Greg K. Essick for his invaluable suggestions on the statistical analysis, Charles Schroeder at the Albert Einstein School of Medicine for his performance of the magnetic resonance brain imagi ng, and James Chrobak for comments on the manuscript. Supported by NEI 5 R01 9223 and ONR N00014-93-1-0334.
Figure 1
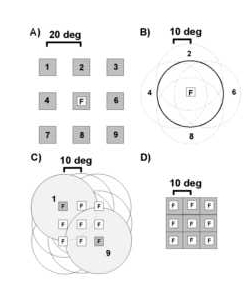
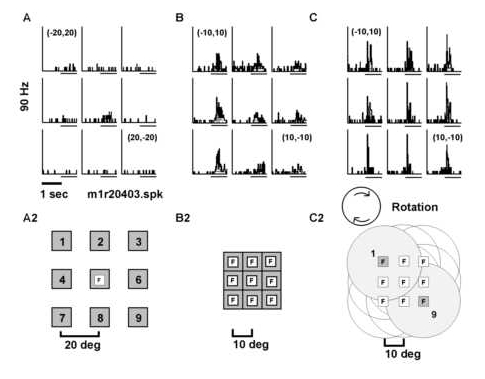
Three spatial parameters were varied in fixed block design to characterize neural selectivities. A) Retinotopic position of a stationary square of light was varied. Animals were required to fixate (F) centrally while a 5-10o square of light was flashed on/off in nine different positions (labeled 1-9) on a 3 x 3 grid with a grid step of 20o. Thus, the test area for responses to static light subtended 45 to 50o of visual angle in the horizontal and ve rtical axes. B) Centers of attended optic flows were displaced relative to the fixation point. Animals were required to maintain a central fixation while attending to the structure of an optic flow stimulus centered at nine different retinotopic position s on a 3 x 3 grid with a displacement step of 10o. C) Fixation positions were varied on a 3 x 3 grid with a grid step of 10o while retinotopic position was maintained for optic flow stimuli. The fixation and corresponding display p ositions for two sites (1 and 9) are illustrated with the light gray discs. The optic flow display diameter was 40o for both retinotopic and fixation tests. D) Fixation positions were varied while retinotopic position was maintained for stati onary squares of light symbolized with the gray squares.
Figure 2
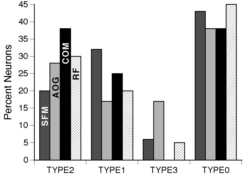
The percentages of neurons for the four different categories of significance as described in the Methods are plotted. These categories were designed to test the hypotheses of non-response to the stimulus, non-specific response to th e visual stimuli, and specific response to the stimuli. Percentages were generated from data for all three hemispheres. About 45 % of the neurons tested had "TYPE 0" or no significant effect of 1) pattern of structure from motion (SFM); 2) angle of gaze ( AOG); 3) displacement of center of motion (COM); and 4) retinotopic displacement for a stationary square (RF). The remaining half of the tested neurons were primarily "TYPE 2" or "TYPE 1". TYPE 2 neurons had significant effects with the spatial parameter varied. TYPE 1 neurons had significant display onset responses but showed no significant difference in mean firing rate with the spatial parameter varied. A small percent of the neurons had a significant effect of the stimulus parameter in the absence of a significant effect with stimulus onset (i.e. TYPE 3 significance). For tests of fixation effects, the TYPE 3 significance was due to a direct effect of fixation on the baseline firing rate as determined with an independent analysis of the effects of fi xation position on pre-stimulus onset firing rate.
Figure 3
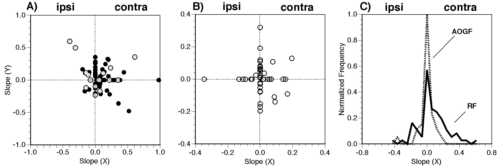
Distribution of the linear terms from the general linear model of the response of the area 7a neurons. A) Coefficient plots for retinotopic displacement of a stationary square (black filled circles) and for structured motion (gray f illed circles). The a x and a y terms of the general linear model were plotted against each other. The sign of the slopes were adjusted so that ipsi-lateral and contra-lateral agreed in all hemispheres. B) Coefficient plots for the modulation of the visual response w ith a constant retinotopic position of the stimulus (i.e. gain fields). All data for the static squares and the optic flow stimuli are grouped. C) Distributions of the horizontal slopes of the retinotopic (RF) and the angle of gaze (gain) field fits. Only the data from the stationary square retinotopic test (i.e. black filled circles in panel A) were used for the "RF" histogram.
Figure 4
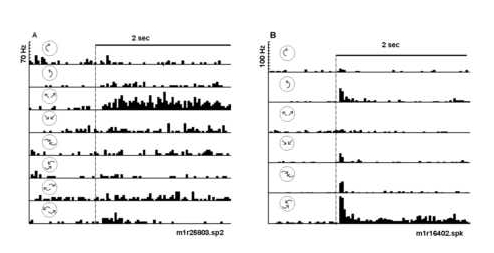
Peri-stimulus time histograms illustrate selectivity of two neurons to expansion and spiral motion, respectively. The optic flow displays were varied in a fixed block design to assess selectivity. A) This neuron responded selectively to expanding radial motion (third histogram). Note that there was little or no response to all the other optic flows tested. The neuron was structure selective (radial versus rotation or spiral) and direction selective (radial expansion versus compression). B) Another neuron responded selectively to counterclockwise compression spiral motion (bottom histogram). Smaller responses to pure rotation, pure radial motion, and clockwise compression spirals were observed. The dotted line indicates the time of stimu lus onset. The icons represent the type of optic flow; a 2 sec time bar is given.
Figure 5
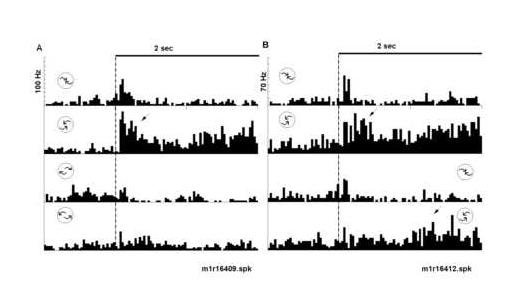
Peri-stimulus time histograms illustrate the relative selectivity to counterclockwise spiral motion. The optic flow displays were varied in a fixed block design to assess selectivity. Responses illustrated in part A and B come from the same neuron as in Figure 4B. A) The neuron was tested for selectivity to four different spiral combinations of radial and rotation motion. The top two histograms are a repeat test of clockwise and counterclockwise compression sensitivity. The botto m two histograms illustrate the neurons response to clockwise and counterclockwise expansion spiral motion. Again, the neuron responded most robustly to counterclockwise compression motion. B) Responses to the conventional display transition order (top t wo histograms) were compared with those to the reverse transition order (bottom two histograms). The neuron responded most robustly to the onset (dotted line) of counterclockwise compression motion and minimally to the onset of shuffled displays. Note th e response in the second phase of the task (arrow) to the onset of counterclockwise compression (bottom histogram). The icons represent the type of optic flow; the icon positions represent the task phase at which structured motion occurred (i.e. early ver sus late). A 2 sec time bar is given.
Figure 6
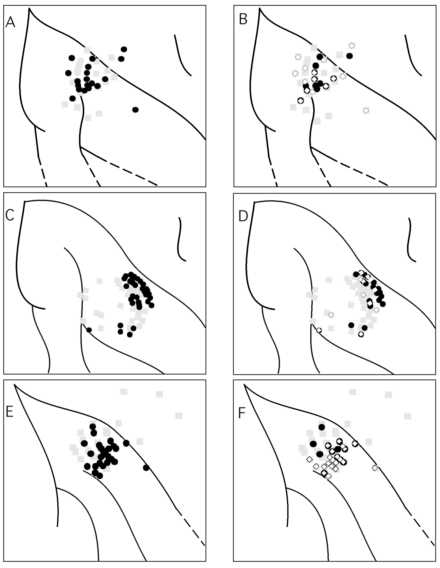
Recording sites with selective neural responses to structured motion were largely overlapping with those sites with significant responses for retinotopic position of a square. Each row represents a different hemisphere. All the pene tration sites for a given hemisphere are plotted with light gray squares and recordings are taken from the upper few millimeters of the cortex. The black circles of panels A, C, and E are the sites with any selectivity to motion, i.e. structured random do t motion, translation random dot motion, or vector motion of a square. (The data for the vector motion of a square is taken from Siegel and Read, 1997). Panels B, D, F show sites with selective responses to optic flow (black filled circles), and sites wit h retinotopic selectivity to a stationary square (white diamonds). (The sites with selective responses to vector motion of a square were not included in B, D and F.) Note there is some overlap of optic flow selective and position selective neurons but t here are sites with no overlapping selectivity in spite of tests for both. Selectivity is defined here as a significant effect of the stimulus parameter and its onset time across a particular stimulus set, see Methods and Siegel and Read (1997).
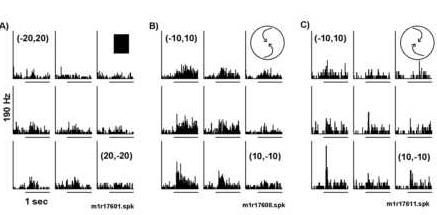
Figure 7
Structured motion selectivity was unaffected by retinotopic displacement of the visual display. A) The neuron responded to stationary squares in the upper visual field. There was a suppression of the response to the 10o s
quare when flashed over the fixation point (0o,0o) that was not seen with structured motion displays. B) Responses of the same neuron to four structured motion displays centered over the fixation point, black histogram, position (0o,0o) or in the upper right visual field, white histogram, position (10o,10o). The neuron responded strongly to rotary motion (clockwise and counterclockwise, top two panels) and minimally to radial motion (bottom
two panels). There was a small decrement in the total responses observed for displays centered in the upper right (compare white histograms to black histograms) but rotation motion selectivity was conserved. The left side of the horizontal bar indicates
stimulus onset; the length of the bars denoting stimulus onset represents 50 msec. The total height of the peri-stimulus time histogram indicates 210 Hz.
Figure 8
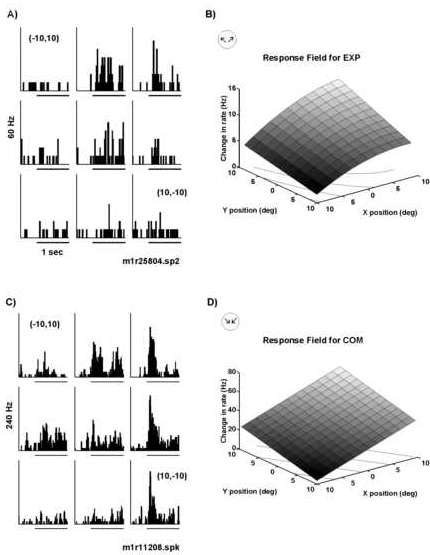
Peri-stimulus time histograms and corresponding quantitative fits of responses to retinotopically displaced optic flow as observed for two parietal neurons. A) Histograms for a neuron located in area 7a of the right hemisphere. The neuron was selective for radial motion with a maximal response to expansion. Retinotopic position preference was found for expansion motion in the central and upper right quadrant of the visual field. Minimal responses were observed for expansion displays displaced 10o degrees contralateral to or below the fixation point. B) The response field fit (see model in Methods) for the data in panel A. The response field fit reflected the data with a minimum at (-10o,10o) and a ma ximum in the upper right portion of the visual field. The X and Y coefficients both had significance values of P<.005. C) This neuron was located in area 7a of the left hemisphere of the same monkey and it was selective for radial motion with the str ongest response to compression. Minimal responses were observed for stimuli located in the lower left quadrant (-10o,-10o). D) The fit of the data in panel C shows that the responses increased linearly as the stimulus was moved upwar d and to the right. The significance values for the coefficients in X and Y were P(ax)=0.0001 and P(ay)=0.0006, respectively. In all trials, the monkey was fixating at the primary position (0o,0o). The frequency scale is indic ated to the left of the peri-stimulus time histogram; the stimulus begins at the onset of the 1 sec time bar. The lines in the XY plane in panels B and D indicate a contour plot of the data.
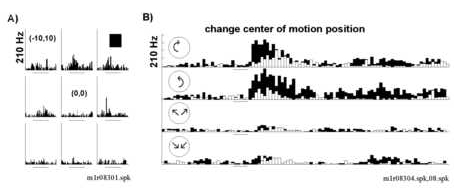
Figure 9
Responses varied with displacement of structured motion, but the selectivity for optic flow was conserved. This neuron was selective for spiral motion. A) A weak response to the onset of a stationary square at various retinotopic po sitions was observed. B) The response to counterclockwise spiral motion varied with small displacements of the display. Larger responses were observed for stimuli displaced to the left (ipsilateral). C) A similar retinotopic receptive field shape was recorded with clockwise compression spirals. Note that the selectivity to the direction of the optic flow is maintained at all positions.
Figure 10
Modifying the angle of gaze while keeping the retinal locus constant modified the responsiveness of neurons to structured motion. A) The neuron responded best to a stationary square positioned over the point of fixation while the ey e position was always at (0,0o). A2). Schematic representation of the fixation point and square stimulus. B) The neuron’s response to a stationary square varied as a function of the nine different fixation positions tested. B2) A schematic of t he tests for the effect of eye position on the response to the square. Note that the retinotopic position of the square was fixed so that it always appeared superimposed on the fixation point. C) The neuron was selective to rotation with a strong respons e found for clockwise rotation. Variation of the fixation point altered the magnitude of the visual response to clockwise rotation. C2) Schematic of fixation point and optic flow stimulus. The fixation point is illustrated as a white square labeled with a n "F" and the structured motion displays are denoted with circles. The displacement step for fixation and display center is given in degrees of visual angle. Peri-stimulus time histograms for A, B and C all come from the same neuron. Peri-stimulus time hi stograms for A, B and C were generated in three separate test blocks (03, 06 and 08) and the data come from the same neuron (unit M1R204).
Figure 11
The angle of gaze gain field varied with the visual stimulus type for the cell whose peri-stimulus time histograms are given in Figure 10. A1) Receptive field plot for a stationary flashed stimulus. The maximal response occur red when the animal fixated centrally was over the fovea (0o,0o). A2) The same data are shown at a higher magnification to emphasize the peaked shape of the receptive field. B) The gain field while viewing a stationary square was skewed to the left or contralateral field. C) The gain field while viewing clockwise rotation motion was skewed to the upper visual field. Significance values for the slopes depicted here are all p < .0003.
Figure 12
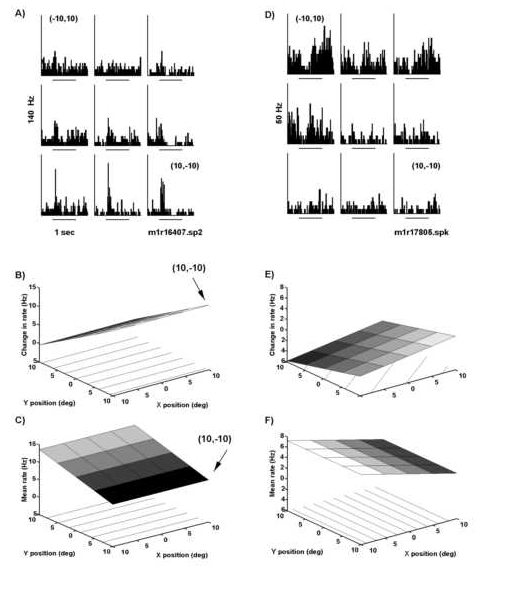
A direct angle of "gaze" or fixation effect was observed for some neurons. Fixation position was varied over nine positions while retinotopic position of the visual stimulus remained constant. The firing rate associated with a given fixation position was analyzed for the 500 msec block of time prior to stimulus onset. A) Peri-stimulus time histograms for one neuron arranged according to fixation position. Note that the firing rate in the 500 msec prior to stimulus onset was greater when the fixation position was at (-10o,10o) versus (10o,-10o). The response to its preferred structured motion (counterclockwise compression spiral) was greatest at fixation positions in the lower rig ht visual field (-10o,10o). B) Angle of gaze gain field fit for the neuron in panel A. The gain field fits were based on computed change in firing rate between the 500 msec prior to and following stimulus onset. Note t hat the response to structured motion increased linearly from upper to lower portions of the visual field. C) Fixation or gaze field for the neuron in panel A. Fixation position was maintained in the 500 msec prior to stimulus onset and the mean f iring rate during this 500 msec block of time was used to generate the gaze response field fit. The direct effect of fixation compliments the response to visual stimulus. Note that the mean firing rate prior to appearance of the visual stimulus is greater for fixations in the upper hemifield and less for fixation in the lower hemifield. The same modulatory effect is illustrated for another neuron in panels D, E, and F. D) Peri-stimulus time histograms illustrate that this neuron fired strongly wit h fixations in the upper hemifield. The stationary square stimulus suppressed the firing rate. The suppression of firing rate was also greatest in the upper hemifield. E) The angle of gaze gain field for the neuron in panel D. Maximal inhibition wa s found in the upper left hemifield. F) The gaze field fit for the fixation effect (500 msec prior to stimulus onset). Panel A and D follow the conventions of Figure 10B while the lower four panels follow the conventions of Figure 11.
Figure 13
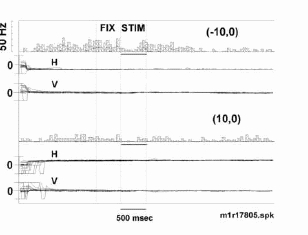
Eye position was held steady in the 500 msec period prior to and following visual display onset. Peri-stimulus time histograms and records of eye position are plotted for two different fixation positions. Large movements were observ ed with saccades from various initial positions to the test fixation position. Note that even though the neuron fires quite differently for fixation in the upper (-10o,0o) versus lower (10o,0o) visual fields, th e movement of the eye about a given fixation point is similar. Stimulus is a stationary square centered over the fixation point. Tick marks for eye position are +20o visual angle.
References
- Andersen RA, Asanuma C, Cowan WM (1985a) Callosal and prefrontal associational projecting cell populations in area 7A of the macaque monkey: a study using retrogradely transported fluorescent dyes. J Comp Neurol 232:443-455.
- Andersen RA, Essick GK, Siegel RM (1985b) Encoding of spatial location by posterior parietal neurons. Science 230:456-458.
- Andersen RA, Essick GK, Siegel RM (1987) Neurons of area 7 activated by both visual stimuli and oculomotor behavior. Exp Brain Res 67:316-322.
- Andersen RA, Asanuma C, Essick GK, Siegel RM (1990) Cortico-cortical connections of anatomically and physiologically defined subdivisions within inferior parietal lobule. J Comp Neurol 296:65-113
- Andersen RA, Siegel RM (1990) Motion processing in primate cortex. In: Signal and sense: local and global order in perceptual maps. Eds. Edelman G, Gall W, Cowan WM, New York: Wiley-Liss, pp. 163-184.
- Boussaoud D, Ungerleider LG, Desimone R (1990) Pathways for motion analysis: cortical connections of the medial superior temporal and fundus of the superior temporal visual areas in the macaque. J Comp Neurol 296:462-495.
- Bushnell MC, Goldberg ME, Robinson DL (1981) Behavioral enhancement of visual responses in monkey cerebral cortex. I. Modulation in posterior parietal cortex related to selective visual attention. J Neurophysiol 46:755-772.
- Cavada C, Goldman-Rakic PS (1989) Posterior parietal cortex in rhesus monkey: I. Parcellation of areas based on distinctive limbic and sensory corticocortical connections. J Comp Neurol 287:393-421.
- Connor CE, Gallant JL, Preddie DC, Van Essen DC (1996) Responses in area V4 depend on the spatial relationship between stimulus and attention. J Neurophysiol 75:1306-1308.
- Critchley M (1953) The parietal lobes. New York: Hafner Press.
- Duffy CJ, Wurtz RH (1991) Sensitivity of MST neurons to optic flow stimuli. I. A continuum of response selectivity to large-field stimuli. J Neurophysiol 65:1329-1345.
- Duhamel JR, Colby CL, Goldberg ME (1992) The updating of the representation of visual space in parietal cortex by intended eye movements. Science 255:90-92.
- Fischer B, Boch R (1985) Peripheral attention versus central fixation: modulation of the visual activity of prelunate cortical cells of the rhesus monkey. Brain Res 345:111-123.
- Graziano M, Andersen RA, Snowden RJ (1994) Tuning of MST to spiral motions. J Neurosci 14:54-67.
- Lagae L, Maes H, Raiguel S, Xiao DK, Orban GA (1994) Responses of macaque STS neurons to optic flow components: a comparison of areas MT and MST. J Neurophys 71:1597-1626.
- Lappe M, Bremmer F, Pekel M, Thiele A, Hoffman KP (1996) Optic flow processing in monkey STS: a theoretical and experimental approach. J Neurosci 16:6265-6285.
- McCollum J, Siegel RM (1996) Neuronal selectivity to retinotopic centers of motion in area 7a of the behaving monkey. Neurosci Abstr Soc 22:1619
- Motter BC, Steinmetz MA, Duffy CJ, Mountcastle VB (1987) Functional properties of parietal visual neurons: mechanisms of directionality along a single axis. J Neurosci 7:154-176.
- Motter BC, Mountcastle VB (1981) The functional properties of the light-sensitive neurons of the posterior parietal cortex studied in waking monkeys: foveal sparing and opponent vector organization. J Neurosci 1:3-26.
- Newsome WT, Pare EB (1988) A selective impairment of motion perception following lesions of the middle temporal visual area (MT). J Neurosci 8:2201-2211.
- Orban GA, Lagae L, Verri A (1992) First order analysis of optical flow in monkey brain. PNAS 89:2595-2599.
- Perrone JA, Stone LS (1994) A model of self-motion estimation within primate extrastriate visual cortex. Vision Research 34:2917-2938.
- Pouget A, Sejnowski TJ (1994) A neural model of the cortical representation of egocentric distance. Cerebral Cortex 4:314-329.
- Quraishi S, Siegel RM (1997) Attentional modulation of parietal area 7a neurons in the awake behaving monkey. Invest Opthal Vis Sci (Supp ) 38:S625.
- Robinson DL, McClurkin JW, Kertzman C (1990) Orbital position and eye movement influences on visual responses in the pulvinar nuclei of the behaving macaque. Exp Br Res 82:235-246.
- Robinson DL, Petersen SE (1992) The pulvinar and visual salience. TINS 15:127-132.
- Saito H, Yukie M, Tanaka K, Hikosaka K, Fukada Y, Iwai E (1986) Integration of direction signals of image motion in the superior temporal sulcus of the macaque monkey. J Neurosci 6:145-157.
- Sakata H, Shibutani H, Kawano K (1980) Spatial properties of visual fixation neurons in posterior parietal association cortex of the monkey. J Neurophysiol 43:1654-1672.
- Sakata H, Shibutani H, Ito Y, Tsurugai K (1986) Parietal cortical neurons responding to rotary movement of visual stimulus in space. Exp Brain Res 61:658-663.
- Salinas E, Abbott LF (1995) Transfer of coded information from sensory to motor networks. J Neurosci 15:6461-6474.
- Schaafsma SJ, Dijkstra TMH, Duysens J (1995) Periodic oscillating stimuli are more effective than visual stimuli of constant speed for VIP cells of the awake monkey. Soc Neurosci Abstr 21:665.
- Siegel RM, Andersen RA (1988) Perception of three-dimensional structure from motion in monkey and man. Nature (Lond ) 331:259-261.
- Siegel RM, Andersen RA (1990) The perception of structure from visual motion in monkey and man. J Cognitive Neurosci 2:306-319.
- Siegel RM, Read HL (1994) Egocentric motion from optic flow and eye position in area 7a of the behaving macaque. Soc Neurosci Abstr 20:1278
- Siegel RM, Read HL (1997) Analysis of optic flow in the monkey parietal area 7a. Cerebral Cortex 7:1-20.
- Steinmetz MA, Motter BC, Duffy CJ, Mountcastle VB (1987) Functional properties of parietal visual neurons: radial organization of directionalities within the visual field. J Neurosci 7:177-191.
- Steinmetz MA, Connor CE, Constantinidis C, McLaughlin JR (1994) Covert attention suppresses neuronal responses in area 7a of the posterior parietal cortex. J Neurophysiol 72:1020-1023.
- Van Essen DC (1985) Functional organization of primate visual cortex. In: Cerebral Cortex Eds. Peters A. and Jones, EG. pp 259-329. NY: Plenum Publishing.
- Wolbarsht ML, MacNichol EF, Wagner HG (1960) Glass insulated platinum microelectrodes. Science 132:1309-1310.
- Zipser D, Andersen RA (1988) A back-propagation programmed network that simulates response properties of a subset of posterior parietal neurons. Nature 331:679-684.