I This investigation was supported by a Postdoctoral Fellowship (BF?6317?C) from the National Institutes of Health, United States Public Health Service, and currently by a Fellowship from the Foundations' Fund for Research in Psychiatry.
INTRODUCTION
IN A PREVIOUS STUDY (9) evidence was found that a large proportion of the spontaneous electrical activity recorded from the basal forebrain of the anesthetized cat was generated bilaterally by the prepyriform cortex, not by the subcortical structures in which the recording electrodes were located. This finding raised the question of how the oscillating potentials of the brain are transmitted, i.e., to what extent the spread of EEG activity is due (i) to continuous spread of membrane depolarization along axonal or dendritic fibers; (ii) to the formation of intracellular?extracellular current loops such as occur on a shorter time scale in peripheral nerve, with instantaneous field distribution of the current through the brain; and (iii) to successive activation of contiguous cells. To approach this question a study was made of the nature of the various wave forms generated by the prepyriform cortex and of their rates, directions, and distances of spread in and around the cortex.
The prepyriform cortex was found to be well suited to this type of analysis, since it generates a very high amplitude evoked potential (28), which at the same time is relatively simple in form (4, 10, 13). It has many of the electrical attributes of sensory neocortex, including both surface?positive and surface?negative responses, but with the major exception that a transcommissural evoked potential is absent. The dimensions of the cortex are sufficiently large with respect to the size of recording electrodes so that damage resulting from placement usually does not noticeably alter the records of cortical electrical activity. Its boundaries are clearly defined, structurally, histologically, and electrically. Knowledge of its histological structure, which is simpler than that of sensory neocortex, is adequate for the cat (3, 23), and some excellent studies are available from the mouse (21, 25).
In the anesthetized cat the cortex can be exposed surgically by resection of the eye and the orbital plate, and it can be reached stereotaxically from above without disturbing the molecular layer or its relations to the circulatory systems or the underlying skull. A major afferent system, the lateral lateral olfactory tract, lies directly on the surface (cf. 10, 22), so that there can be separation of afferent and efferent pathways at the surface and the base of the cortex. On the other hand, some of these features limit the applicability of the information so derived, so that the results and interpretations cannot be applied without reservation to the understanding of other cortical structures.
The method of analysis consisted of four steps. (i) The spontaneous prepyriform wave forms were examined and classified. (ii) The prepyriform evoked potentials were examined and classified, while varying the site, frequency, and intensity of electrical stimulation of the prepyriform cortex and its afferent pathways. (iii) The distributions of a representative evoked potential in space and time were mapped. (iv) The distributions of this evoked potential were compared with those of other evoked potentials and with those of the various spontaneous wave forms. In this way a clear picture was obtained of the patterns of distribution of the spontaneous electrical activity, which would be exceedingly difficult to derive from a study of the spontaneous activity alone.
Acute experiments were carried out on adult cats anesthetized with pentobarbital. ? Surgical exposure of the prepyriform area required removal of the eye and orbital plate, with retention of the supraorbital ridge. The recording electrodes were either silver balls resting on the cortex, stainless steel needles sharpened and insulated to a tip diameter of 10?50y, or coaxial electrodes of #26 nichrome wire in #23 needle tubing. The latter types were inserted stereotaxically normal to the surface either vertically from above or horizontally from below. Electrical stimulation was applied either by paired silver balls on the cortex or the olfactory bulb, or by coaxial electrodes inserted into deeper structures. Sites of deep stimulation were determined histologically by means of electrolytic deposits. Records were made with an ink?writing recorder with a flat frequency response from 0.5 to 50 c./sec., or with a preamplifier and oscilloscope with 3 db. fall?off points at 0.2 and 40,000 c./sec. and an input impedance of 10 MsL High? and low?frequency filters were sometimes used to examine appropriate frequency components selectively.
Electrodes for chronic implantation consisted of insulated #26 nichrome wires, which were inserted in pairs cemented together with one exposed tip 1.5 mm. directly above the other. One of the tips was placed in the molecular layer of the cortex and the other at the "base," i.e., in the fusiform cell layer or immediate, subjacent white matter. This was done by placing a stimulating electrode in the olfactory bulb and lowering the paired electrode to the vicinity of the prepyriform cortex by means of stereotaxic coordinates. Final positioning was obtained by evoking activity in the field with the stimulating electrode and lowering the recording electrode until the evoked potential from the lower tip was a mirror image of that from the upper tip. From one to four pairs were implanted in each side in the prepyriform cortex of 15 cats. Histological confirmation has been obtained in all of them. The wires were attached to the skull with dental cement and soldered to the terminals of one or two plugs. These in turn were cemented to the skull and to steel screws set in the skull. Stimulation and recording were done over periods up to 12 months.
RESULTS
1. Forms of spontaneous electrical activity
a. Characteristics of dominant wave form. In the normally active cat the dominant wave form of the prepyriform potentials was a sinusoidal wave with a frequency of approximately 34?38/sec. (Fig. 1, A?B). This wave form came in bursts lasting up to 1 sec. and at amplitudes ranging up to 2 mV. peak?to?peak. In addition, there were sinusoidal waves at approximately the same amplitude but at half the dominant frequency (Fig. 1, C?D). The maximum amplitude of the former was found in the anterior prepyriform cortex (A?B), whereas that of the latter occurred in the posterior prepyriform cortex predominantly in the temporal lobe (C?D). At both frequencies the spontaneous activity at the surface was an approximate mirror image of the activity at the base of the cortex. Deviations from the dominant frequency were common, and usually took the form of modulation in single bursts, e.g., a continuous shift in frequency from 56/sec. to 38/sec. in a burst lasting up to 1 sec. (A?B, at left); more stable variations of 5?10% either upwards or less commonly downwards also occurred. Oscilloscopic records showed the presence of sinusoidal waves at higher frequencies (predominantly 95?110/sec., but only rarely at double the dominant frequency) at amplitudes up to 300?500 MicroVolts.
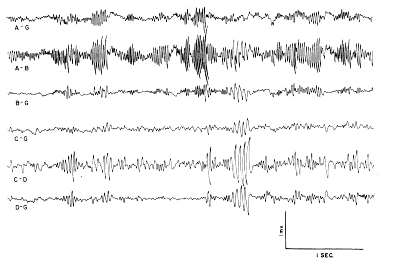
FIG. 1. Fast wave activity of left prepyriform cortex with low frequencies filtered out. Lines A?G and C?G are monopolar from the surface of the frontal and temporal prepyriform cortex respectively. Lines B?G and D?G are monopolar from base 1.5 mm. deep to A?G and C?G. Lines A?B and C?D are corresponding bipolar records at same gain as monopolar records. Note that antiphasic monopolar signals are accentuated in bipolar records.
b. Respiratory wave. In the low?frequency range there was a repetitive wave form, the amplitude of which ranged up to 300 MicroVolts, and the frequency of which was related to that of respiration (Fig. 2, AB). It consisted of a blunt, surface?negative peak following inspiration by 150?250 msec. and lasting about 200 msec., and after a short delay a surface?positive peak of approximately equal amplitude and duration. During rapid respiration (e.g., sniffing) the two peaks coalesced into a continuous wave form. The bursts at the dominant frequency were closely related to this slow wave, occurring predominantly from the peak of the positive wave to the beginning of the negative wave (Fig. 2, A'B').
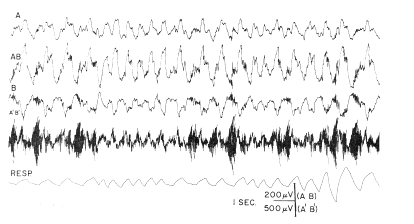
FIG. 2. Low?frequency (lines A, AB, B) and high?frequency (line A'B') activity of frontal prepyriform cortex recorded near site of maximum amplitude of respiratory wave is compared with respiration (obtained with pneumograph around chest attached to strain gauge-inspiration upwards). Acceleration in respiration occurred during sniffing. Records A and B are monopolar from surface and base of cortex respectively; records AB and APB' are bipolar from same electrodes.
According to Liberson (15), respiratory waves in the basal forebrain electrical activity were reported in 1953 by Novikova and Khvoles. Those observed here were regarded as intrinsic electrical changes rather than movement artifacts for several reasons. The surface?negative and surface?positive peaks were each accompanied by mirror?image peaks at the base of the cortex. Similar and approximately synchronous respiratory waves were seen in both the left and right prepyriform areas (Fig. 3). The high?frequency bursts had a precise temporal relation to the slow wave, and the ratio of their amplitudes was fairly constant at different points of the cortex. The waves were stable in form from week to week in each animal and were very similar although not identical in all of six cats with appropriately placed electrodes. The peak amplitudes were found in the olfactory bulbs, and in the anterior frontal prepyriform cortex; had these waves been due to respiratory movements of the brain within the skull, such a gradient would be difficult to account for. Moreover, the waves at anterior points slightly preceded those at posterior points on each cortex. The same waves were found despite frequent replacement of the recording cable; they occurred with or without perceptible movement of the head or cable and were independent of posture. When movement artifacts did occur, they were clearly discerned because of the association with movement, their irregular distribution, and the lack of a turnover. The source of these waves did not lie in the nasal mucosa, since the instillation of 2?4 ml. of procaine HCl (1 %) in both nostrils did not alter their relationship to respiration. Tetanization of the lateral olfactory tract at 500?1000/sec. at intensities several times threshold (for single shock) did not alter either the respiratory or fast waves, unless sniffing occurred.
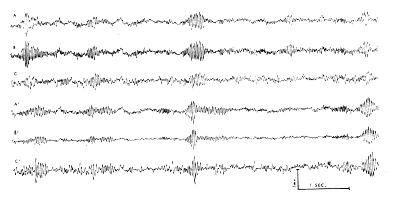
FIG. 3. Simultaneous bipolar records without filters from prepyriform cortex of waking cat with implanted electrodes, three on left side (A, B, C) and three from right side (A', B', C'). Site A is about 3 mm. posterior to left olfactory bulb, site B is 3 mm. behind A, and site C is 3 mm. behind B, all near left lateral olfactory tract. Sites A', B', and C' are symmetrically located on right side. Placement is representative of most of the cats. Monopolar records from electrodes showed that at each site electrical activity at base was antiphasic with respect to activity at surface (cf. Figs. 1, 2, 4).
c. Comparison of tracings from multiple prepyriform sites. Similar activity was present on both sides, usually at slightly different frequencies (Fig. 3) and unequal in amplitude. In 10 of 15 cats with implanted electrodes the amplitude was up to five times greater on one side than on the other. In two of the 10 it was higher on the right and in the other eight cats on the left. In Fig. 3 there are three bipolar records from the left cortex and three from the right, each from a point on the surface with respect to a point at the base 1.5 mm. distant. The bursts tend to occur approximately synchronously on the two sides. In the center set of bursts the frequency at all points on the left is 36/sec. and on the right 34/sec. The wave forms recorded anteriorly on both sides lead those recorded posteriorly by about 1/8 cycle, i.e., about 3 msec. Since the distance from A to C is about 6 mm., the rate of spread indicated by phase shift is about 2 m/sec. This phase lag is barely detectable in Fig. 3. Alternatively, measures were obtained by placing the signal from A on the horizontal deflection plates of an oscilloscope and the signal from C on the vertical plates. The resulting Lissajous ellipse was then photographed and the amount of phase shift was computed from the ratio of the lengths of the major and minor axes. This method gave approximately the same results.
d. Sleep and anesthesia. The presence of bursts
of fast waves add respiratory waves was associated with the presence of
an active state of behavior (Fig. 4, right). During sleep there were suppression
of the electrical activity at the dominant and higher frequencies and the
appearance of irregular slow waves, which were aperiodic and not related
to respiration (Fig. 4, left). Many of the irregular waves at the surface
had mirror?image waves at the base. Spindle bursts were frequently seen
in monopolar recordings from the surface and the base (Fig. 4, first and
second arrows), but they were in?phase at the surface and base of the cortex
and were not present in bipolar recordings on the surface with respect
to the base of the cortex (Fig. 4, second line). An additional state was
found to accompany behavioral arousal and the alerting response of the
neocortical EEG, in which the irregular waves and spindle bursts disappeared,
but the bursts at the dominant frequency were not present (Fig. 4, beginning
at third arrow). The respiratory waves might or might not be present in
this state, but continuous low?amplitude electrical activity at the dominant
and higher frequencies was readily detectable. This state was associated
with a lack of overt behavioral activity.
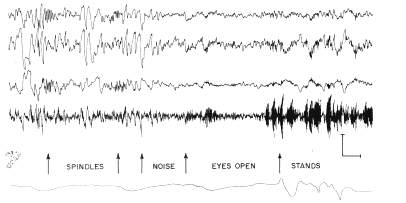
Fig. 4. Same recording arrangement as in Fig 2 was used in sleeping cat. At third arrow brief noise was made by striking two pieces of metal together. At fourth arrow eyes opened, and at fifth arrow cat stood up. Calibration: 200 MicroVolts (top three lines), 500 MicroVolts. (4th line), 1 sec.
The spontaneous activity of the prepyriform cortex in cats under pentobarbital was lower in amplitude and more variable in appearance, although no new wave forms appeared. Irregular waves were commonly present, but regular slow waves synchronous with respiration were not observed. Fluctuations at 19/sec. and 38/sec. were rarely present, nor could bursts at this frequency be distinguished; there was no perceptible relation between the lower and higher frequencies, and there was much less synchronization of frequency and amplitude at different sites within each cortex. There were in many cats sinusoidal waves at intermediate frequencies of 8?15/sec., which did not have the form of spindle bursts. Spindle bursts were frequently noted in recordings from the neocortex and in monopolar recordings from the prepyriform cortex, but as with sleep spindles they were in phase at the surface and base of the cortex, i.e., a "turnover" for them could not be located in or below the cortex. In general, the electrical activity under pentobarbital resembled that in the sleeping cat but at lower amplitude.
a. Stimulation of cortical surface and olfactory tract. Direct, single?shock, bipolar stimulation of the exposed surface of the cortex of the anesthetized cat produced a polyphasic change in potential, which consisted of a dicrotic surface?negative peak (cf. Fig. 5) lasting 15?25 msec. and followed by a surface?positive wave and then a small second negative wave, each lasting 30?40 msec. The magnitude of the potential as well as to some extent its form was dependent on both the intensity and the duration of stimulation. At high stimulus intensities (6?10 threshold) the duration of the positive wave increased and the second negative wave disappeared. The chronaxie for both peaks of the initial dicrotic negative wave was 0.085?().095 msec. The minimal start?latency was 0.75 msec. The wave form spread concentrically from the site of stimulation with decremental amplitude to the approximate histological limits of the prepyriform cortex at a rate of 1.7?2.2 m/sec.
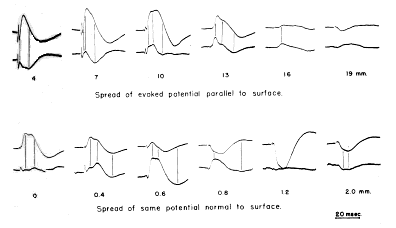
FIG. 5. Comparison is made between monopolar records (upper tracing of each pair) and bipolar records (lower tracing, at twice gain of monopolar record) of prepyriform evoked potential. Distances in parallel series are posteriorly from base of olfactory bulb; distances in normal series are toward base from surface. Retouched.
Several sites were found outside the cortex, the electrical stimulation of which evoked prepyriform potentials with the same basic form as that evoked by direct stimulation but differing in significant ways. Stimulation with a single shock at the base of the olfactory bulb caused the potential to move as a wave from anterior to posterior tangentially to the surface of the cortex at the same rate (Fig. 6, top line). Its amplitude was initially incremental (4?7 mm.) and showed a plateau in the central portion of the cortex along the lateral olfactory tract (7?10 mm.). Near the borders the amplitude diminished (16 mm.) and the wave length increased; at the borders the amplitude decreased rapidly and an initial positive wave appeared (19 mm.). The second peak of the dicrotic first negative wave was most prominent in the posterior frontal prepyriform cortex (10 mm.). Repetitive stimulation at rates above 3/sec. caused augmentation of the first peak and suppression of the second peak; there was post?tetanic potentiation of the first peak (and not the second) lasting up to 3?4 min. following tetanization for 20 sec. of the ipsilateral olfactory bulb.
b. Stimulation of other sites. Stimulation of the periamygdaloid cortex in most cats evoked a potential of the same form, polarity, and velocity, which spread tangentially over the cortex from posterior to anterior. The amplitude at any one point of the cortex was constant during repetitive stimulation of the lateral periamygdaloid cortex at rates up to 10/sec., but it decreased to zero during the first 10?20 stimuli delivered to the medial periamygdaloid cortex. The latency of the potential increased with increasing distance of the site of stimulation from the temporal prepyriform cortex. No prepyriform potential was evoked by stimulation of the entorhinal cortex. In some cats the polarity of the wave was reversed (Fig. 6, PA), so that the initial wave was positive at the surface and negative at the base of the cortex. In all other respects the waves were similar. No explanation of this reversal is available. A similarly inverted wave form of long latency (6?8 msec.) was sometimes found during repetitive stimulation of the anterior commissure. This was an augmenting response, which became maximal at stimulus rates of 10?15/sec. after the first 1 or 2 sec. of stimulation. In addition, a highly variable and complex response was found following stimulation in the vicinity of the anterior olfactory nucleus, which it is thought might represent the result of mixed stimulation of the medial and lateral olfactory tracts.
Three types of potential could not be evoked: an antidromic potential, e.g., by stimulation of the medial forebrain bundle (cf. 14); a propagated orthodromic potential, e.g., in the globus pallidus (23) or claustrum (3) following direct stimulation of the cortex [for an opposing view see Berry et al. (4)]; or a transcommissural potential following stimulation at symmetrical points on the opposite cortex.
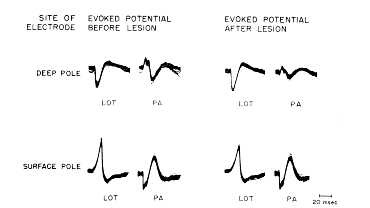
FIG. 6. Each tracing consists of 100 superimposed evoked potentials following 1/sec. stimulation of either lateral olfactory tract (LOT) or periamygdaloid cortex (PA). Recording microelectrode was placed in deep pole by insertion from above through caudate nucleus. Tracings were recorded before and after electrolytic lesion was made at site of recording with recording electrode (50 MicroAmps for 15?30 sec.). Electrode was then moved across zero isopotential to surface pole. Tracings were again made before and after second lesion was made. Results show that lesions caused diminution of both phases of initially negative potentials but not of initially positive potentials.
Stimulation of the midline nuclei of the thalamus in some cats evoked an initially surface?negative prepyriform potential. During repetitive stimulation the second peak of the dicrotic first wave was accentuated, whereas the first part was diminished. Following tetanization of the thalamus the second peak (and not the first) was potentiated, whether the subsequent evoking stimulus was applied to the thalamus or the lateral olfactory tract. No recruiting response was found in the cortex, which could not be attributed to current spread from the adjacent neocortex.
The prepyriform potentials evoked by direct stimulation or by stimulation of the lateral olfactory tract or periamygdaloid cortex in cats with implanted electrodes were similar in form to those evoked in cats under pentobarbital, differing only in the greater prominence of the second surface?negative wave in the former group. Light doses of pentobarbital (25?30 mg./kg.) brought about an increase in amplitude in the second peak of the dicrotic negative wave and a decrease in amplitude of the second negative wave. Doses in excess of 40 mg./kg. suppressed both the second peak and the second negative wave.
Since there is as yet no way to join these variations into a comprehensive analysis, the observations may be summarized by pointing out that the important changes in wave form were in the site of initial negativity and in the relative amplitudes of the two peaks of the initial dicrotic wave. Apart from this the wave form was remarkable for its simplicity and universality. Furthermore, despite changes in form and amplitude due to changes in the site, frequency, or intensity of stimulation, all these surface potentials were accompanied by mirror?image potentials at the base of the cortex. Both surface and deep potentials were abolished simultaneously by 4?5 min. of anoxia, by the intravenous administration of massive doses of curare (24), or by continuous electrical stimulation at rates in excess of 200 sec.
Surface spread and triphasic action potential. It has already been noted that the tangential spread of the evoked potential over the surface of the cortex occurred with a definite latency and without a "turnover." Preceding the potential evoked by stimulation of the lateral olfactory tract and having the same threshold was a triphasic action potential (initially positive), which was continuously "decremental," and the velocity of which was the same as the start velocity of the evoked potential (Fig. 5, top lines 4?10 mm.). Lesions of the tract or the application to the surface of the cortex of small squares of filter paper soaked in procaine HCl (1 %) blocked the further progression of the action potential as well as the evoked potential beyond the affected region, but did not alter the potentials proximal to the block. The triphasic potential did not have a mirror image potential at the base of the cortex (Fig. 5, bottom lines). It was resistant to anoxia and massive intravenous doses of curare, and did not diminish in amplitude at stimulus rates of up to 500/sec. Its maximal amplitude occurred over the lateral olfactory tract. At the margins of the cortex it became diphasic but remained initially positive. Similar diphasic waves were frequently observed on the surface of the cortex immediately preceding the potentials evoked by stimulation of the thalamus and periamygdaloid cortex, but only if the wave was initially surface?negative. The same phenomenon was noted preceding the wave evoked by direct stimulation, but only if great care was taken to eliminate the shock artifact.
b. Spread to base and zero isopotential. The spread of the evoked potential from the surface to the base of the cortex was a process with different characteristics. (A steel microelectrode tapered to 5 microns,, insulated, and transected to leave a flat recording surface 15 microns in diameter was used to obtain accurate measurements. A coaxial electrode was used to obtain the tracings in Fig. 5.) As the exploring electrode was inserted through the outer layers in a direction normal to the surface, decrement in amplitude became prominent at a depth of about 300 microns and continued rapidly until a small polyphasic evoked potential remained (Fig. 5, bottom lines, 0.6 mm.); at times no change in potential could be detected. Electrolytic deposits examined histologically showed that this region of zero isopotentiality lay in the vicinity of the junction of the molecular and pyramidal cell layers. It was also found that unit potentials could be recorded in large numbers at and below the zero isopotential, whereas they were virtually absent on the superficial side of the zero isopotential. Still deeper the approximate mirror?image potential characteristic of the base appeared, became maximal at depths of 1.0?1.5 mm. and
then gradually decreased at greater depths (2.0 mm.). No triphasic action potential was present. It was not possible to demonstrate crest latency in the negative peak of the molecular layer nor in the positive peak of the deep layers in directions normal to the surface; furthermore, the two peaks recorded along a line normal to the cortical surface occurred at approximately the same time.
c. Effects of lesions in superficial and deep poles. Electrolytic lesions made in the molecular layer (i.e., in the surface pole), resulted in diminution of the amplitude of both the surface?negative and surface?positive waves, when the evoked potential was subsequently recorded in the lesion with the same electrode (Fig. 6, LOT, before lesion). Similar lesions made in the polymorphic cell layers (i.e., in the deep pole) did not decrease the deep?positive and deep?negative potentials similarly recorded, and in fact they often increased slightly (Fig. 6, LOT, after lesion).
d. Comparison of monopolar and bipolar recordings. A significant difference between the patterns of spread tangential to the cortex and normal to the cortex was also shown by comparison of concomitant monopolar and bipolar recordings (Fig. 5). Since the bipolar record is a measure of a difference in potential, close approximation of two electrodes with respect to the wave length of an electrical disturbance recorded monopolarly from either one permits treatment of the bipolar record as an increment. A precise definition of the relationship between such records requires the use of partial derivatives, but an adequate understanding of the two patterns found in the prepyriform cortex can be gained by visualizing two waves of potential in a volume?conductor-one moving through the volume with a constant form, velocity and amplitude, and the other remaining stationary in the volume and changing in amplitude.
In the first case the bipolar record from two electrodes placed on the line of movement gives the slope of the moving wave, so that the peaks of the bipolar record occur concomitantly in time with the maximum slopes of the monopolar records. This is the case of peripheral nerve, in which the bipolar record of the action potential tends to approach the first derivative with respect to time of the monopolar record. The prepyriform potential is more complex, since it is variable in amplitude, variable in form, and composed of a dicrotic initial negative peak. Despite these complexities the negative and positive peaks of the bipolar record from one electrode with respect to a second electrode 2 mm. distal to it on the lateral olfactory tract tend to occur at the times of the maximum negative and positive slopes of the wave recorded monopolarly from the first electrode (Fig. 5). This is evidence that the prepyriform evoked potential moves as a wave across the surface.
In the second case (the stationary wave) bipolar records give the gradient of potential in space. The gradient changes at the same instant as the entire wave, so that the peaks of the monopolar and bipolar records are concomitant in time; but the minimum amplitudes of the bipolar record are found at locations of the electrode in space which give the maximum amplitudes of the monopolar record, and vice versa. Records from the prepyriform cortex taken from one electrode with respect to another 300 microns deep to the first are complicated by the occurrence of the dicrotic negative peak and by a delayed deep?negative wave without a mirror?image surface wave, which may accompany and partly obscure the surface?positive phase at moderately high stimulus intensities (cf. Fig. 5, monopolar record at 0.6 mm.). They still show clearly that the minimum amplitudes of the bipolar record coincide in space with the maximum amplitudes of the monopolar records, and that the maximum amplitude of the bipolar record occurs across the zero isopotential of the monopolar record. On the other hand, the peak amplitudes tend to coincide in time. The bipolar records therefore approach the first derivative of the monopolar records with respect to distance and not to time. This is evidence that the prepyriform evoked potential does not move as a wave from the surface to the base of the cortex.
e. Reversal of poles and of effects of lesions. Stimulation of the anterior commissure or the periamygdaloid cortex in some cats resulted in a reversed wave, which was initially deep?negative and surface?positive (Fig. 6, PA, before lesion). The loci of maximal amplitude of these responses were lateral and posterior in the prepyriform cortex to those following stimulation of the lateral olfactory tract. In these doubly inverted potentials microlesions in the deep pole (i.e., the site of initial negativity) resulted in diminution of both the positive and negative waves, whereas microlesions in the surface pole did not (Fig. 6, PA, after lesion). In four cats in which arrangements were made to stimulate the anterior commissure and the lateral olfactory tract alternately, it was found that the location of the zero isopotential was the same for both types of evoked potential.
Methods and conditions of mapping. Comparison of these data makes it apparent that, irrespective of the site of stimulation, during the establishment of the evoked potential two fundamentally different processes are at work if there is distribution in time of the evoked potential over the surface of the cortex; (ii) there is instantaneous distribution of the potential in space through the base of the cortex. A reduction in the complexity of the data can be attained by making a series of measurements of potential in space and time, and from them making a series of maps at each of a series of instants of the spatial distribution of potential. A still further reduction can be attained by mapping the spatial distribution of peak amplitudes without regard to their time of occurrence. Both methods were tried, and the second was found to be superior for three reasons: it was simpler; it provided in a single series of maps the loci of peak amplitudes in the field of the cortex; and it provided a more accurate picture of the spatial distribution of the spontaneous electrical activity of the cortex. The first method simply showed the development of the peaks of activity from anterior to posterior along the cortex. The second method involved some distortion, e.g., the overlapping of isopotentials at the margin of the cortex, but this was minimized by placing the planes of the maps in the coronal plane, which lies at an angle of about 60_ from the major direction of movement of the evoked potential along the surface of the cortex. Still further reduction in distortion could have keen attained by taking the plane of mapping 90_ to the cortical surface, i.e., perpendicular to the line of movement of the potential, but this would have involved presentation of the maps at an unusual plane of histological section of the brain.
Among the more important conditions of the mapping procedure were the use of a monitoring electrode at a moderately distant point in the field to control spontaneous variations in field amplitude and the use of a steel microelectrode just large enough to exclude unit potentials and to have a stable impedance. The duration of stimulation (of the root of the lateral olfactory tract) was kept at chronaxie, the intensity at four times threshold, and the frequency at 4/sec., a rate at which fatigue and potentiation were not apparent, and at which the second peak of the initial surface?negative dicrotic peak was always suppressed below the first. The electrode was moved through the tissue along each of a series of tracks until the evoked potential had reached predetermined positive or negative amplitudes. It was then photographed and the coordinates were recorded. Transfer of the resulting maps to the histological sections required compensation for the distortion of the tissues resulting during mounting. Measurements from point to point are not possible in such distorted planes, but measurements from known lines are considerably more reliable. The vertical positions of points were determined along the electrode tracks (most of which could be seen) and the horizontal positions were measured along these lines from the zero isopotential. The latter was placed on the pyramidal cell layer of the cortex, which required making changes in its position but not in its curvature. The procedure was done on seven cats.
b. Characteristics of dipole field. The resulting maps (Fig. 7) showed that the potentials fell into a series of continuous distributions compatible with an electrical event in a relatively homogeneous conductor (save for the underlying skull). There were two major poles of opposing sign during the first (surface?negative) phase, which were approximately reversed during the second (surface?positive) phase. The superficial pole lay in the molecular layer in the vicinity of the lateral olfactory tract. The deep pole lay in the middle of the concavity of the gyrus, somewhat lateral and posterior to the superficial pole. The boundaries of the poles were not sharply defined except at the zero isopotential. The peak amplitude in the superficial pole exceeded that in the deep pole by a factor of 1.5?2.5. On the other hand, planimeter measurements of the areas enclosed by the 2 mV. and 4 mV. contours (allowing 1.0 and 0.5 mm. respectively for the distance of the negative contours from the surface of the cortex) indicated that the deep areas exceeded the surface areas by about the same factor. Assuming a direct proportionality between area and volume, the volume of the deep pole appeared to exceed that of the superficial pole by approximately the same amount that the potential of the superficial pole exceeded that of the deep pole. Since potential in a volume conductor is proportional to charge density, the products of potential times volume indicate that the total charges of the two poles at the peak surface?negative amplitude were approximately equal, but opposite in sign. Hence the field is an approximate dipole field. Since the field exists in a volume conductor it must be inferred that during the first phase current flows from the base of the cortex to the surface and during the second phase in the opposite direction. This current is of maximal extracellular density across that part of the zero isopotential surface located between the poles, but it appears to spread through adjacent tissues with little relation to histological boundaries. Since the evoked potential is the IR product of this field of current, it is clear how such distant factors as the curvature of the cortex and the impedance of the skull can in part determine the magnitude of the evoked potential recorded at any point in the field. Bishop and O'Leary (5) observed a similar field in the superior colliculus of the cat, giving it a slightly different interpretation.
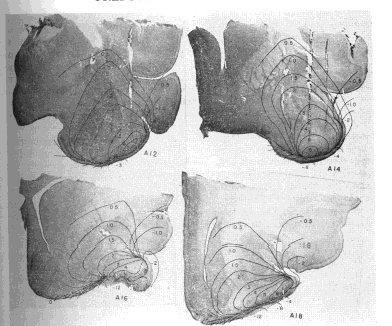
FIG. 7. Coronal histological sections of cat brain at designated stereotaxic levels. Superimposed on these are isopotentials in millivolts of prepyriform evoked field at peak amplitudes independently of time of occurrence.
c. Oscillating injury potentials. During the procedure of mapping the dipole the microelectrodes frequently struck the inner surface of the skull and were bent into the shape of a hook. (Planes of measurement in which this occurred were discarded.) During withdrawal of such an electrode across the zero isopotential (and occasionally during insertion of a normal microelectrode) there occurred oscillations in potential at the same frequency as the spontaneous electrical activity but at 5?20 times greater amplitude. When a steel microelectrode was deliberately bent into a 50 micron hook and insulated to leave an exposed surface 20 microns in diameter, such oscillations (Fig. 8, A) could regularly be elicited at many points in and below the cellular layers of the cortex but not in the outer two?thirds of the molecular layer. They were seen most often and at greatest amplitude in the vicinity of the zero isopotential. These oscillations resembled the "injury potentials" seen during microelectrode recordings from single units in several respects. The fields were of small size with extremely steep gradients. The discharges were transient, lasting from a few seconds up to several minutes, and were repetitive and regular but usually intermittent. The amplitude was variable and tended to diminish rapidly with time. The discharges were elicited only by movement of the electrode with respect to the tissue. There were two major differences: (i) the frequency of the injury potential is variable, whereas the frequency of these oscillations was not; and (ii) the duration and form of a single injury potential are roughly the same as those of a unit potential, whereas the duration and form of a single oscillation were very similar to those of the spontaneous waves of the prepyriform cortex. If during one of these bursts the lateral olfactory tract was stimulated at 4/sec., it was found that the evoked potential could often be observed with roughly the same increase in amplitude as that of the spontaneous oscillation (Fig. 8, B, a, b). This was the only circumstance in which highly localized, high?amplitude evoked potentials could be recorded with microelectrodes (down to 10 microns in diameter). Oscillating injury potentials as often did not contain the evoked potential (Fig. 8, B, c, d), even when they were found at the zero isopotential of the cortex.
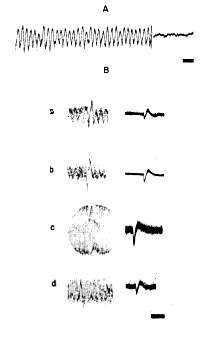
FIG. 8. A: oscilloscopic tracing of oscillating injury potential and of subsequent level of spontaneous activity at same site and same gain. Time, 100 msec. B: by use of up to 30 superimposed sweeps evoked potential in some injury oscillations was found to be increased in amplitude in comparison to similar records made after abatement of oscillations (a, b), but in other injury oscillations evoked potential was superimposed on oscillations without alteration in its magnitude (c, d). Time, 100 msec.
Precise mapping of the amplitude distribution of spontaneous potentials was not feasible, due to the mixture of prepyriform potentials with potentials generated neighboring structures, as well as the continuous and uncontrolled variation in amplitude of the spontaneous potentials. This was particularly true of anesthetized cats with low?amplitude spontaneous activity. The method used to map such potentials was to place two electrodes in the field, one stationary and the other exploratory, and to compare the relative amplitudes of spontaneous and evoked potentials at different points in the field with these monopolar records (Fig. 9).
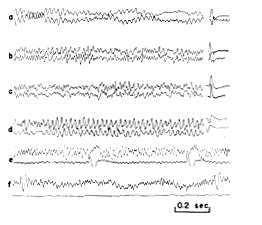
FIG. 9. A series of comparisons of spontaneous electrical activity of prepyriform cortex and prepyriform potential evoked by stimulation of lateral olfactory tract. Points in (a d) are located in or near the two poles of field. The upper tracing is from surface of olfactory bulb and lower (at decreased gain) is from surface of prepyriform cortex. In (f) upper tracing is from surface of cortex and lower (at equal gain) is from zero isopotential just beneath site of upper tracing. Stimulus interval in (e?f): 1 sec.
a. Distribution normal to surface. Along lines normal to the cortex there was no significant phase shift in the peak amplitudes of the sinusoidal waves at the dominant frequency other than the inversion of the wave form, i.e., a 180_ phase shift (Fig. 9, a). The ratios of differences in amplitude of the evoked and spontaneous potentials at different points in the field along normal lines were identical; in particular the positions of the maximum amplitudes and of the zero isopotential (Fig. 9, f) for the two types were identical. When the amplitude of the evoked potential was altered by anoxia (6), locally applied procaine, or intravenously administered curare (24), simultaneous changes of the same order of magnitude occurred in the spontaneous activity. The mirror?image quality of the activity at a point on the surface and an underlying point also persisted, there being no circumstance in which dissociation could be observed other than the previously noted injury potential.
b. Distribution tangential to surface. Along lines tangential to the cortical surface the spontaneous activity showed phase shifts that were commensurate in amount with the rate of spread of evoked potentials. The phase shifts of the peak amplitudes of the spontaneous and evoked potentials often coincided (Fig. 9, b?d). However, comparison of records from different points on the surface of the cortex showed that there was no clear correlation between the amplitudes of evoked and spontaneous activity. It has already been noted that the poles of the fields of potential evoked by stimulation of various extracortical structures did not coincide with one another, and it may further be recalled that although there was a coincidence of major changes in amplitude of spontaneous activity and a coincidence of bursts, the amplitude at any point on the cortical surface was not nearly as closely correlated with the amplitude at neighboring points on the surface as with points on lines normal to the surface (Fig. 3).
In the system of analysis of potentials in a volume conductor developed by Wilson et al. (29), an initially positive diphasic wave is ascribed to depolarization advancing toward the exploring electrode, whereas an initially negative diphasic wave is ascribed to receding depolarization. The assumption is required that each cell in the system under study be continuous in the direction of movement of the potential. This system was loosely adapted to the study of the cortex by Marshall et al. (19), and it is now widely accepted that a surface?positive wave represents an ascending depolarization, whereas a surface?negative wave represents depolarization moving from the surface to the base. While this analysis is useful for describing the electrical activity of many parts of the nervous system, e.g., peripheral nerve (16) and some central nuclei (17), it does not appear to be valid for the prepyriform evoked potential. This potential is distinct from those systems in that it moves tangentially over the surface without an initially positive wave, until the borders of the cortex are reached. The total distance of spread (up to 14 mm. or more) is greater than the horizontal extension of the indigenous cells. Since a triphasic action potential can usually be recorded prior to the evoked potential, and since the latter follows the former by an interval compatible with monosynaptic transmission, it seems clear that the superficial spread of the evoked potential is due to successive activation of contiguous cells by the propagated action potential. In one sense the surface spread of activity can be ascribed to cells with continuous extension which produce an initially positive moving potential, but this description applied only to the exogenous fibers of the lateral olfactory tract and their triphasic action potential.
The spread of activity from the surface to the base of the cortex seems at first glance to follow the basic pattern described by Wilson et al. (29), since there is an inversion of the wave form. However, evidence was found excluding the possibility that the surface wave moves to the base (cf. 22). First, there was no demonstrable latency of either potential in directions normal to the surface, whereas movement was readily measured in directions parallel to the surface. Second, there was little and often no change in potential recorded monopolarly at the turnover, which is incompatible with the passage across the turnover of a continuously moving e.m.f. Third, bipolar records from electrodes in a line normal to the cortex had wave forms which approached the first derivative of the concomitantly recorded monopolar forms with respect to distance. Bipolar records taken from electrodes in a line parallel to the surface had forms which approached the first derivative of the monopolar forms with respect to time. The latter case is compatible with a moving e.m.f., as in peripheral nerve (16), the former only with a stationary e.m.f. Fourth, small lesions made in the superficial layers of the cortex resulted in diminution of both the negative and positive phases of the evoked potentials subsequently recorded in the lesions, whereas identical lesions in the deep layers did not cause diminution of either phase so recorded. This finding implies that the spread of current from the surface to the base occurs in the same fashion as the spread of action currents in peripheral nerve into the region of a nerve block (16), i.e., the e.m.f. of the evoked potential does not leave the superficial layer of the cortex. These findings do not exclude the possibility that there is a delay in the movement of the evoked potential from the surface to the zero isopotential; although no evidence was found to support this possibility, the precision of the measurements was not sufficient to permit an inference to be made one way or the other.
In any case, the deep cortical potential must be explained on some other basis than the propagation of an e.m.f. from the surface. An explanation can be derived from the finding that the evoked potential is the product of an approximate dipole field, which is spatially distorted by the high impedance of the underlying skull. This finding implies that during the surface?negative phase a net positive charge is moving into cells in the surface of the cortex, while approximately the same net positive charge is moving out of cells in the base of the cortex. Whether the "extracellular" tissue space is inside or between the glia is for the moment not important (18). Either there are two sets of cells, one at the surface undergoing "depolarization" and one at the base undergoing concomitant "hyperpolarization," or else a single set of cells is present with an intracellular bridge extending across the zero isopotential. Since only superficial e.m.f. could be demonstrated for the evoked field of potential, it is inferred that a single set of cells is present, with parts lying on both sides of the pyramidal cell layer. [O'Leary and Bishop (22) observed what appears to have been the same phenomenon in the avian optic lobe; they concluded that it represented evocation of successive responses by fast fibers.] Since the pyramidal cells rather than the glia have been shown to have this orientation and extension, and since the dendrites ramify through the superficial pole, it is inferred that the e.m.f. of the dipole field are associated with the dendrites (cf. 6, 7, 24). The development of the surface?negative evoked potential may therefore be seen to occur in five stages: (i) the activation of the tips of the dendrites by the action spikes of fibers of the lateral olfactory tract (21, 25); (ii) the spread of this change to the vicinity of the cell body at an indeterminate rate; (iii) the activation of e.m.f. causing the movement of a net positive charge into the cell; (iv) the departure of this charge across the axon membrane; and (v) the migration of this charge through the extraneuronal tissue space back to the surface of the cortex.
The validity of this interpretation postulated by Gesell (11) depends on the core conductor property of the neuron. The ability of peripheral nerve, axon to sustain a longitudinal current has been known since the discovery of the demarcation current. Accurate measurements of this property in both peripheral nerve axons and the cell bodies and dendrites of brainstem nuclei have been made by Lorente de N6 (16, 17) and by Shanes (26). The theory implies the existence of intraneuronal currents of far greater density than those in the extraneuronal medium. This is reflected in peripheral nerve in the high current density at the nodes of Ranvier (27). Such localized peaks of potential could not be discerned in the extraneuronal prepyriform field; f intracellular recordings were not attempted. However, some indirect evidence of the existence of intraneuronal currents of high density was found in the form of an injury potential of very high amplitude with the wave forms of both evoked and spontaneous activity. Such potentials were found in the | vicinity of the main dendritic and axonal shafts of the cortical pyramids with barbed microelectrodes most likely to transect those shafts.
Comparison of the prepyriform evoked field with the antidromically or orthodromically evoked field of spinal motoneurons (8) shows that the former is predominantly dipolar whereas the latter is predominantly monopolar and negative. Hence the term "dendritic depolarization" encompasses two processes, one in which a net positive charge moves into the cell and transiently remains there in association with a change in membrane potential, and the other in which it immediately moves across and out of the cell in association with a change in dendritic (not necessarily membrane) e.m.f. Since the dendrite constitutes an electric double layer (16) and since intracellular recordings are not available, it cannot yet be known whether the e.m.f. lies in the membrane, in the mitochondria or other internal structure, or even in the satellite cells adjacent to the dendrite. The observed excess of negative potential of the superficial pole over the positive potential of the deep pole may perhaps in part be explained on the basis of the coexistence of these processes involving the prepyriform dendrites during the evoked potential.
The occurrence in some cats of evoked potentials with an initially deep negative wave and e.m.f. localized by microlesions to the deep layers indicates that the same explanations hold for the surface?positive responses as for the surface?negative responses. It is not clear whether these two types of response are due to the presence in the prepyriform cortex of large numbers of bipolar pyramidal cells (21) or to two functionally distinct sets of cells, each with processes extending across the pyramidal cell layer. In the four cats examined the zero isopotential for the two types of response was the same, but the poles of the two types of response did not coincide in position in the cortex.
Comparison of the evoked and spontaneous potentials showed that along lines normal to the surface the distribution of amplitudes and phase shifts of the two types were identical, whereas along lines tangential to the surface there was not such a close correlation of amplitudes. These results are consistent with the anatomical orientation of the prepyriform pyramidal cells normal to the surface. Presumably activity at one end of a cell will determine the electrical activity at the other, but activity in one cell will not necessarily determine the activity of its neighbor, although each may reflect the activity of a common input. In view of the many other similarities between the two types of electrical activity which confirm previously established evidence derived from studies of the neocortex (6, 7, 24), it is concluded that the e.m.f. for the two types are the same. In answer to the question raised in the introduction the spread of "EEG waves" from the prepyriform cortex involves all three of the processes listed. There is spread of activation by propagation or electrotonus along the dendrites of each pyramidal cell. Ions (or electrons) move through the interior of the cell forming pulsating or alternating currents of high density, which cross the axon membrane in amounts presumably determined by neuronal, glial, or vascular impedances around the axon. There is movement of this current to and from the surface of the cortex in the form of an extraneuronal field causing an IR drop in adjacent tissues. Finally there is successive activation of adjacent cells, which gives the illusion of a potential continuously propagated tangentially over the surface.
Some tentative conclusions suggested by these answers are (i) that the site of origin of the prepyriform dipole field is in or adjacent to the dendrites; (ii) that this is not the only type of field generated by the prepyriform cortex; (iii) that the most probable site of action of the prepyriform dipole field is in the immediate vicinity of the axons, whether in or beneath the cortex; [v) that the recording of potentials with the type of electrodes used in this study is a measure of the "line voltage" of the return current path; and (v)
that the magnitude of the line voltage may be irrelevant to the local activity of many of?the structures the current traverses.
The surface?negative potential evoked in the prepyriform cortex of the anesthetized cat by stimulation of the lateral olfactory tract spreads tangentially over the surface of the cortex with a measurable latency and without inversion or a preceding positive wave; lesions of the surface block the spread of the potential beyond the lesions. The surface potential spreads to the base without demonstrable latency and with inversion; small lesions in the superficial layers diminish the amplitude of the evoked potential recorded in the lesion, whereas similar lesions in the base do not diminish the evoked potential recorded there. An electrical map of the evoked potential shows that it is the product of a dipole field of current. One pole lies in the molecular layer and contains the electromotive forces (e.m.f.) of the dipole; the other pole lies in and below the cellular layers of the cortex and is passive. Evidence was found that extraneuronal and intraneuronal currents of highest density occur across that part of the zero isopotential lying between the poles. It is concluded that the evoked potential spreads tangentially over the surface because of successive activation of the e.m.f. in or around the dendrites of the pyramidal cells. This e.m.f. drives current into the interior of the cells; the deep potential is produced by the passive emergence of the current from the axons. In several cats an evoked field was also found with e.m.f. in the basal layers of the cortex; this field had its zero isopotential at the same location, but the active and passive poles were reversed, and the potential was initially surface?positive. Evidence is presented that the dominant wave form of the spontaneous prepyriform electrical activity i. generated by the same e.m.f. and has substantially the same distribution in time and space as the prepyriform evoked potential.
1. ADRIAN, E. D. Olfactory reactions in the brain of the hedgehog. J. Physiol., 1942, 100: 459?473.
2. ALEN, W. F. Distribution of cortical potentials resulting from insufflation of vapors into the nostrils and from stimulation of the olfactory bulbs and pyriform lobe. Amer. J. Physiol., 1943, 139: 553?555.
3. BERLUCCHI, C. Ricerche di fine anatomia sul claustrum e sull' insula del gato. Riv. sper. Freniat., 1927, 51: 125?157.
4. BERRY, C. M., HAGAMEN, W. D., AND HINSEY, J. C. Distribution of potentials following stimulation of olfactory bulb in cat. J. Neurophysiol., 1952, 15:139?148.
5. BISHOP, G. H. AND O'LEAnY, J. L. The polarity of potentials recorded from the superior colliculus. J. cell. camp. Physiol., 1942, 19: 289?300.
6. CHANG, H.?T. Dendritic potential of cortical neurons produced by direct electrical stimulation of the cerebral cortex. J. Neurophysiol., 1951, 14: 1?21.
7. CLARE, M. H. AND BISHOP, G. H. Properties of dendrites; apical dendrites of the cat cortex. EEG clin. Neurophysiol., 1955, 7: 85?98.
8. FATT, P. Eleetric potentials occurring around a neurone during its antidromic activ' tion. J. Neurophysiol., 1957, 20: 27?60.
9. FREEMAN, W. J. Oscillating corticonuclear dipole in the basal forebrain of the cat. Seience, 1957, 126: 1343?1344.
10. Fox, C. A., McKINLEY W. A., AND MAGOUN, H. W. An oscillographic study of olfactory system in cats. J. Neurophysiol., 1944, 7: 1?16.
11. GESELL R. The driving forces of increased breathing. Pp. 221?230 in: Moulton, F. R., ed. Blood, heart, and circulation. Washington, D. C., Science Press, 1940.
12. HASANA, B. Ueber die elektrischen Begleiterscheinungen an der Riechsphare bei der Geruchsempfindung. Pflug. Arch. yes. Physiol., 1934, 234: 748?755.
13. KAADA, B. R. Somato?motor, autonomic and electrocorticographic responses to electrical stimulation of "rhinencephalic" and other structures in primates, cat, and dog. Acta physiol. scand., 1951, 24 (Suppl. 83). See Chap. III: Cortical distribution of potentials evoked by olfactory bulb stimulation in cat and monkey
14. LANDAU, W. M. An analysis of the cortical response to antidromic pyramidal tract stimulation in the cat. EEG clin. Neurophysiol., 1956, 8: 445?456.
15. LIBERSON, W. T. Recent advances in Russian neurophysiology. Ann. Rev. Physiol., 1957,19: 557?588. (See p. 562).
16. LORENTE DE N6, R. A study of nerve physiology. Stud. Rockefeller Inst. med. Res., 1947, 131, 132.
17. LORENTE DE N6, R. Action potential of the motoneurons of the hypoglossus nucleus. J. cell comp. Physiol., 1947, 29: 207?287.
18. LUSE, S. A. Electron microscopic observations of the central nervous system. J. Biopphys. Biochem. Cytol., 1956, 2: 531?542.
19. MARSHA11, W. H., TA1BOT, S. A., AND ADES, H. W. Cortical response of the anesthetized cat to gross photic and electrical afferent stimulation. J. Neurophysiol., 1943, 6: 1?15.
20. MAcLEAN, P. D., HORWITZ, N. H., AND ROBINSON, F. Olfactory?like responses in pyriform area to non?olfactory stimulation. Yale J. Biol. Med., 1952, 26: 159?172.
2l. O'LEARY, J. L. Structure of the primary olfactory cortex of the mouse. J. comp. Neurol., 1937, 67: 1?31.
22. O'LEARY, J. L. AND BISHOP, G. H. Analysis of potential sources in the optic lobe of duck and goose. J. cell. comp. Physiol., 1943, 22: 73?87.
23. PAPEZ, J. W. Comparative neurology. New York, Thomas Y. Crowell Co., 1929. xxv, 518 pp.
24. PURPURA, D. P. AND GRUNDFEST, H. Nature of dendritic potentials and synaptic mechanisms in cerebral cortex of cat. J. Neurophysiol., 1956,19: 573?595.
25. RAMON Y CAJAE, S. Studies on the cerebral cortex (limbic structures). Tr. L.M. Kraft. London, Lloyd?Luke, 1955. xi, 179 pp.
26. SHANKS, A. M. Frog nerve as generator of current and voltage. J. cell. comp. Physiol., 1947, 29: 207?287.
27. TASAKI, I. Nervous transmissicn. Springfield, Ill., C. C Thomas, 1953. 164 pp.
28. WARD J. W. Field spread potentials of the olfactory mechanism. Amer. J. Physiol., 1953, i72: 462 470.
29. WILSON, F. N., MACLEOD, A. G., AND BARKER, P. S. The distribution of currents of action and injury displayed by heart muscle and other excitable tissue. Ann Arbor, Univ. Of Michigan Press, 1933. vii, 59 pp.