Trehub, Arnold (1997) Sparse Coding of Faces
in a Neuronal Model: Interpreting Cell Population Response in Object
Recognition. (Chapter 10). In: J.W. Donahoe and V. Packard
Dorsel (eds). Neural-Network Models of Cognition: Biobehavioral
Foundations.
Elsevier/North Holland. 189-202.
SPARSE CODING OF FACES IN A NEURONAL MODEL: INTERPRETING CELL POPULATION
RESPONSE IN OBJECT RECOGNITION
Arnold Trehub
Department of Psychology
University of Massachusetts, Amherst
ABSTRACT
Response to faces as measured by cell discharge in the temporal cortex
of monkeys suggests a sparse cell-population coding of complex visual stimuli.
The prevailing view assumes that a sparse population code requires the
joint contribution of a relatively small group of cells (a neuronal ensemble)
for effective coding and recognition. This assumption is based primarily
on the consistent observation that single cells in the temporal cortex
are broadly tuned rather than narrowly tuned to individual faces. It has
been argued that the joint activity of a relatively small number of broadly
tuned cells, each responsive to a different constituent feature of a face,
could form an ensemble code selective enough to distinguish individual
faces. In the present study, schematic faces were presented as stimuli
to a model neuronal system for visual pattern learning and recognition.
This model effectively codes individual faces by means of competitive activity
among single cells during recognition instead of by ensemble coding. The
computer simulation permitted an analysis of the activity profiles of all
tuned cells during learning and recognition of the faces. All cells were
found to be broadly tuned even though coding was mediated by the discrete
output of single cells on a competitive basis in a sparse neuronal population
rather than by the joint activity of a group of cells. The results show
that the observation of broad tuning of cells in temporal cortex under
typical experimental conditions does not warrant the conclusion that neuronal
ensembles are required for the coding of individual faces. Suggestions
are made for changes in the design of experiments to better test hypotheses
about the coding of faces (or any other complex visual patterns).
INTRODUCTION
A central question for our understanding of visual pattern recognition
in the brain is how neurons in the visual system code perceived objects.
Face recognition is a particularly important aspect of complex pattern
recognition and following the early reports of face-selective cells in
the temporal cortex of monkeys (Gross, Rocha-Miranda, & Bender, 1972;
Desimone, Albright, Gross, & Bruce, 1984), there has been a major effort
to understand the neuronal coding of faces (see, for example, Kosslyn &
Mumford, 1991; Bruce, Cowey, Ellis, & Perrett, 1992). In the typical
experimental procedure, the spike discharge of single cells in the inferior
temporal cortex of the monkey is recorded while the animal is presented
with pictures or drawings of faces. It has been observed that cells which
selectively discharge in response to faces as a stimulus class, exhibit
broad tuning curves in response to the faces of particular individuals.
Mainly on the basis of this observation, the prevailing view is that single
cells cannot adequately account for selective recognition of individual
faces. Instead, it has been proposed that the neuronal processing is in
the form of a sparse population code wherein face recognition requires
the joint contribution of a small population of cells, each selectively
responsive to the presence of a different facial feature (Baylis, Rolls,
& Leonard, 1985; Young & Yamane, 1992). In this formulation, it
is the pattern of activity over an ensemble of cells (a joint activity
vector) that constitutes the recognition code (Gross, 1992; Gross &
Sergent, 1992). An unresolved issue is how a neuronal population code,
sparse though it may be, can selectively evoke a correct recognition response
to a particular member of a stimulus category. This paper examines the
activity levels of individual cells in a simulated neuronal model of visual
object recognition when the system is required to learn and recognize each
face in a group of line-drawn faces. Analysis of cell response profiles
suggests an alternative interpretation against the common view that sparse
coding of a complex visual pattern such as an individual face implies a
neuronal ensemble of separately coded features. The results indicate that
instead of a coding scheme based upon an ensemble of separate features,
a sparse group of cells where each is holistically tuned to a different
exemplar of a particular face, provides effective face recognition.
BRIEF DESCRIPTION OF MODEL
The neuronal model simulated here (Trehub, 1991; chapters 2, 3, 4, 5,
and 7) consisted of five key integrated mechanisms: (a) a 16x16-cell foveal
retina; (b) a mechanism for triggering saccadic excursions to regions of
high edge density in the visual field; (c) a putative post-retinal mechanism
for positioning the centroids of retinotopic excitation patterns close
to a standard internal axis (stimulus capture); (d) a learning mechanism
for tuning synaptic transfer weights on individual adaptive cells (filter
cells) in a detection set to patterns of retinal stimulation; (e) a competitive
(winner-take-all) mechanism that selects a recognition response contingent
on the relative activation levels of cells in the detection set in the
context of each stimulus. The spike frequency of each cell can be considered
as a positive monotonic function of its activation level.
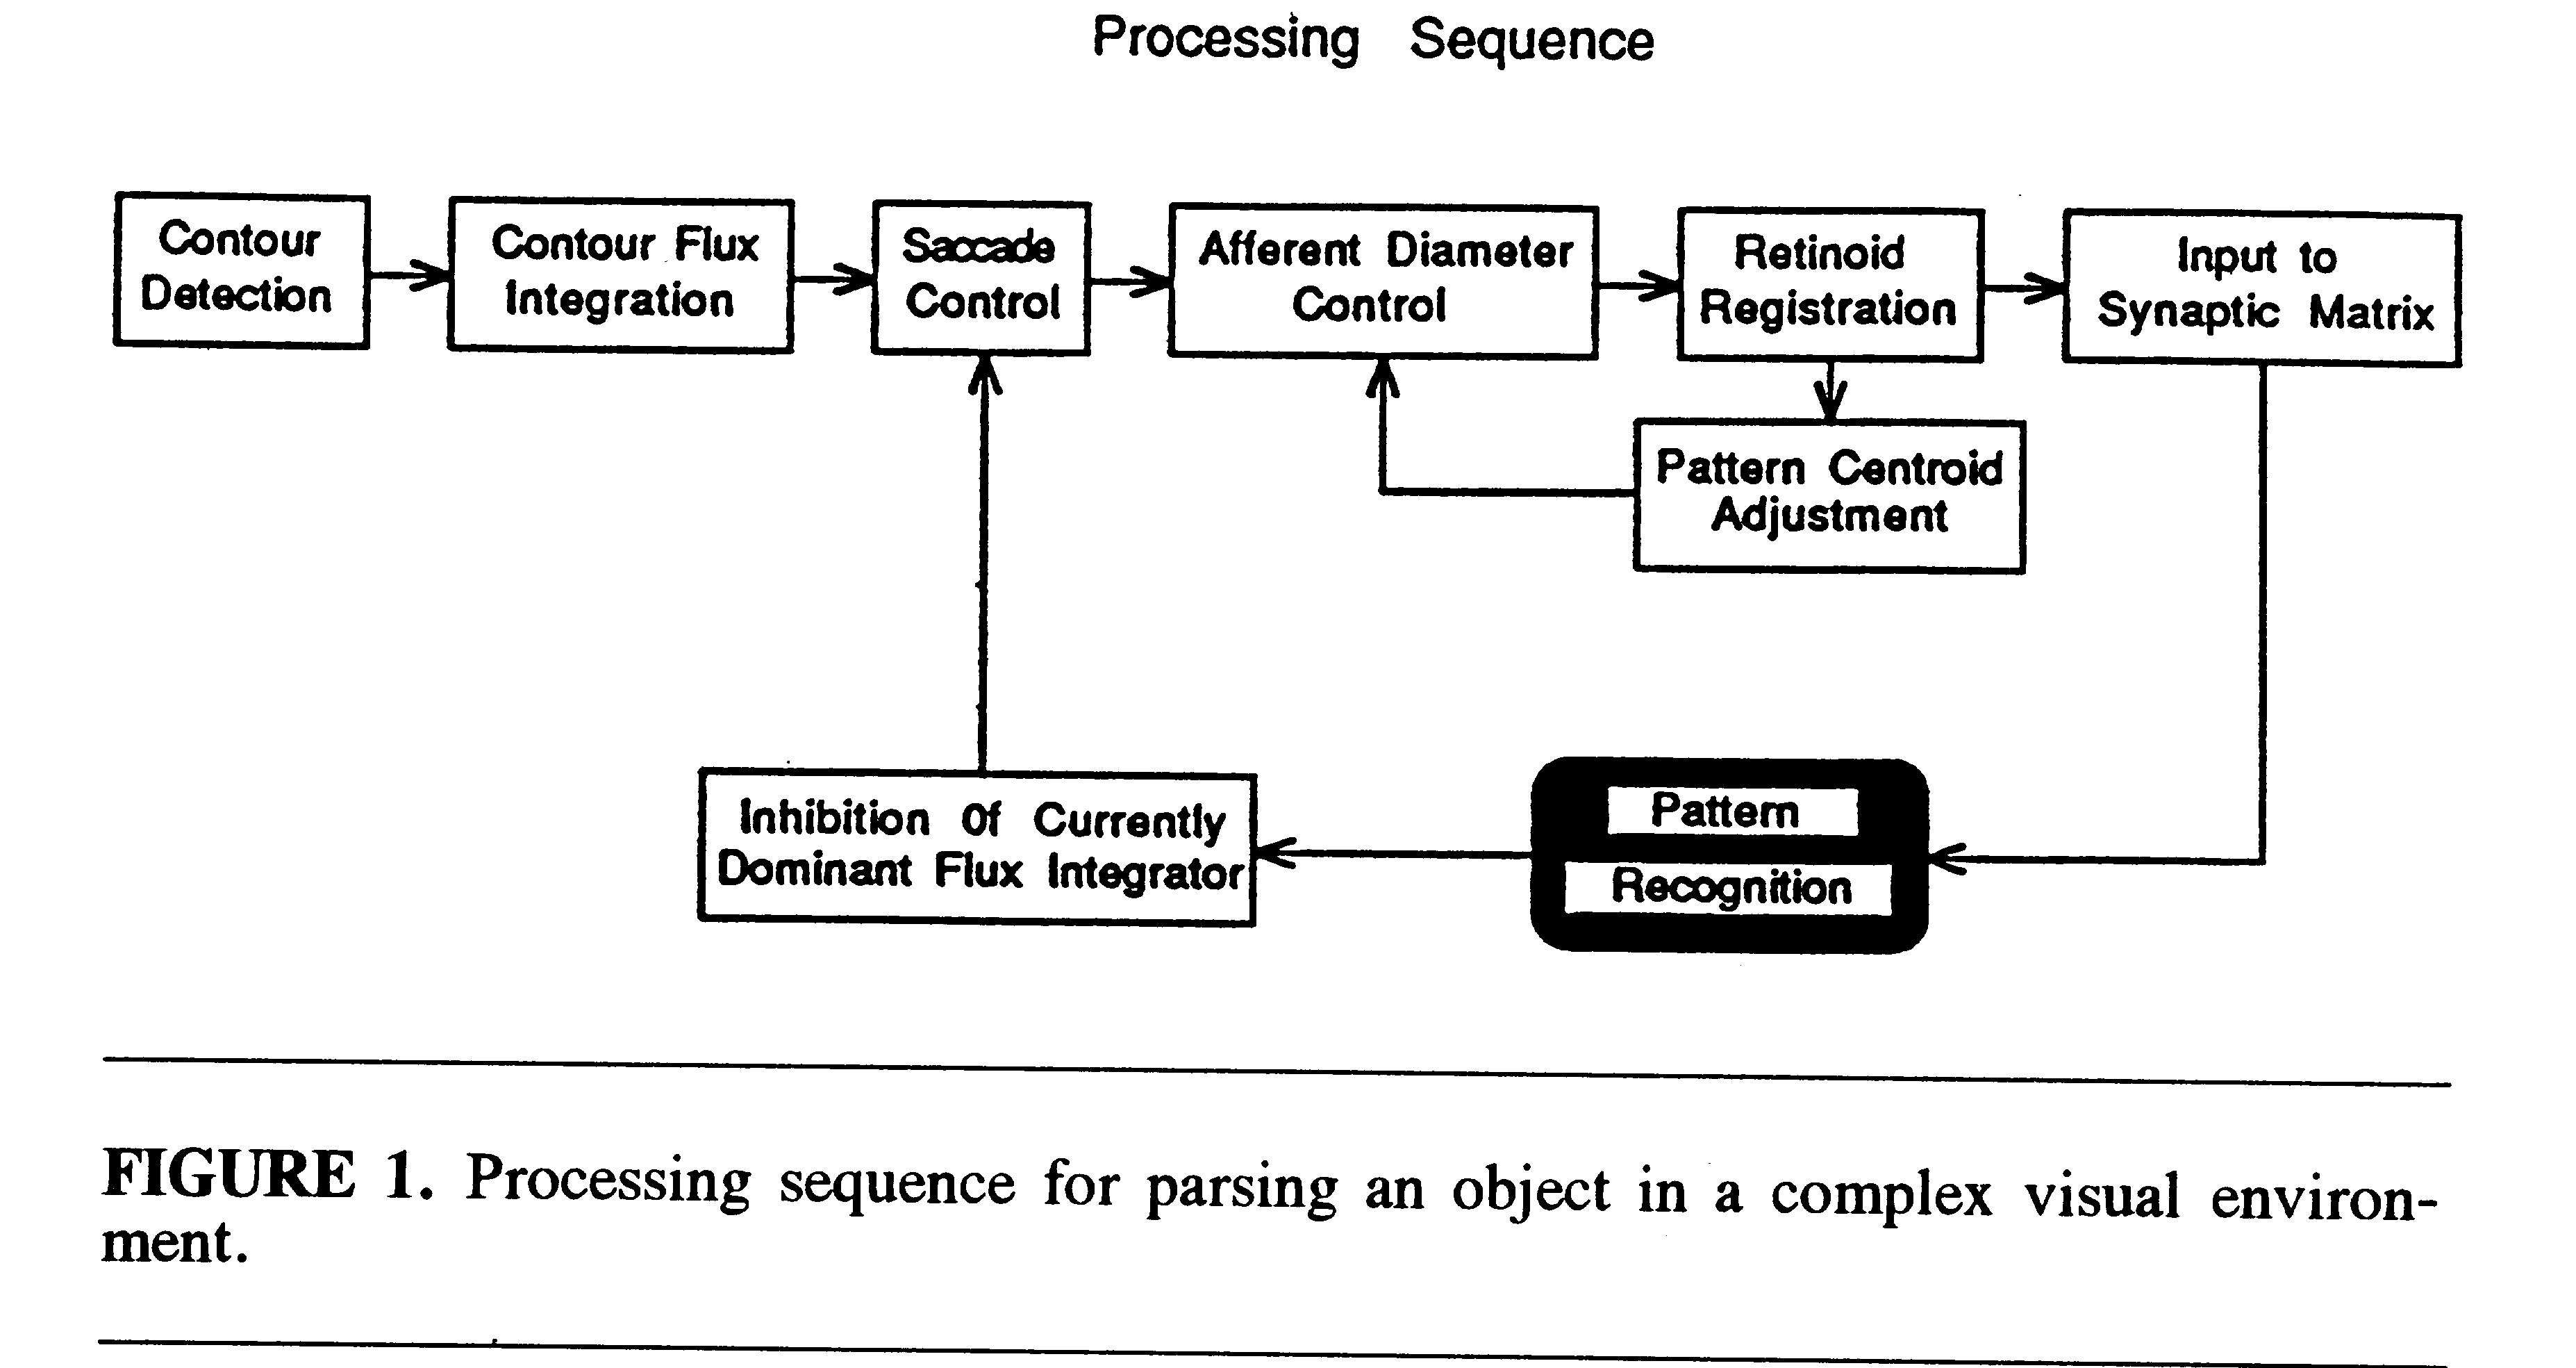
Figure 1 illustrates the processing sequence for parsing an individual
face out of the set of 10 faces presented in the model's visual field.
The total field is analyzed by an array of retinotopically indexed cells
(flux detectors), each of which receives input from a relatively small
region of the complete retinal field. Each flux detector integrates the
amount of visual contour excitation in its particular retinal region and
discharges with a frequency proportional to its total excitation. The contour
flux detectors feed a matched array of cells that control visual saccades.
The flux detector with the highest discharge frequency captures control
of the saccadic apparatus and directs a saccade to the circumscribed visual
region that provides its input. Thus, the region of visual space with the
highest contour density will be fixated first.
There is a field constriction mechanism that limits the fovea-centered
aperture of retinotopic input to a short-term memory module called a retinoid
(Trehub, 1977). The retinoid can translate retinotopic excitation patterns
over cells in an egocentric coordinate space. It is quadrantally organized,
and automatically locates and positions pattern centroids on a standard
reference axis within the visual system by shifting its visual pattern
so that excitation is balanced within a threshold of tolerance over all
quadrants. At the start of the parsing process, the visual field aperture
is constricted to a small window on the stimulus field and an initial tolerance
level is set for hemifield mismatch in the retinoid system. The centroid
of the current effective visual pattern is then shifted to the standard
egocentric reference axis. The visual aperture is progressively enlarged
in a stepwise fashion and, at the same time, the system relaxes its tolerance
for quadrantal-excitation imbalances. At each step, the system seeks to
adjust the current centroid of the stimulus component within the afferent
aperture so that it lies approximately on the reference axis. When the
visual aperture reaches a limiting size, the pattern of retinoid excitation
in its standardized position within the aperture is projected to a neuronal
mechanism for learning and recognition called a synaptic matrix (Trehub,
1991).
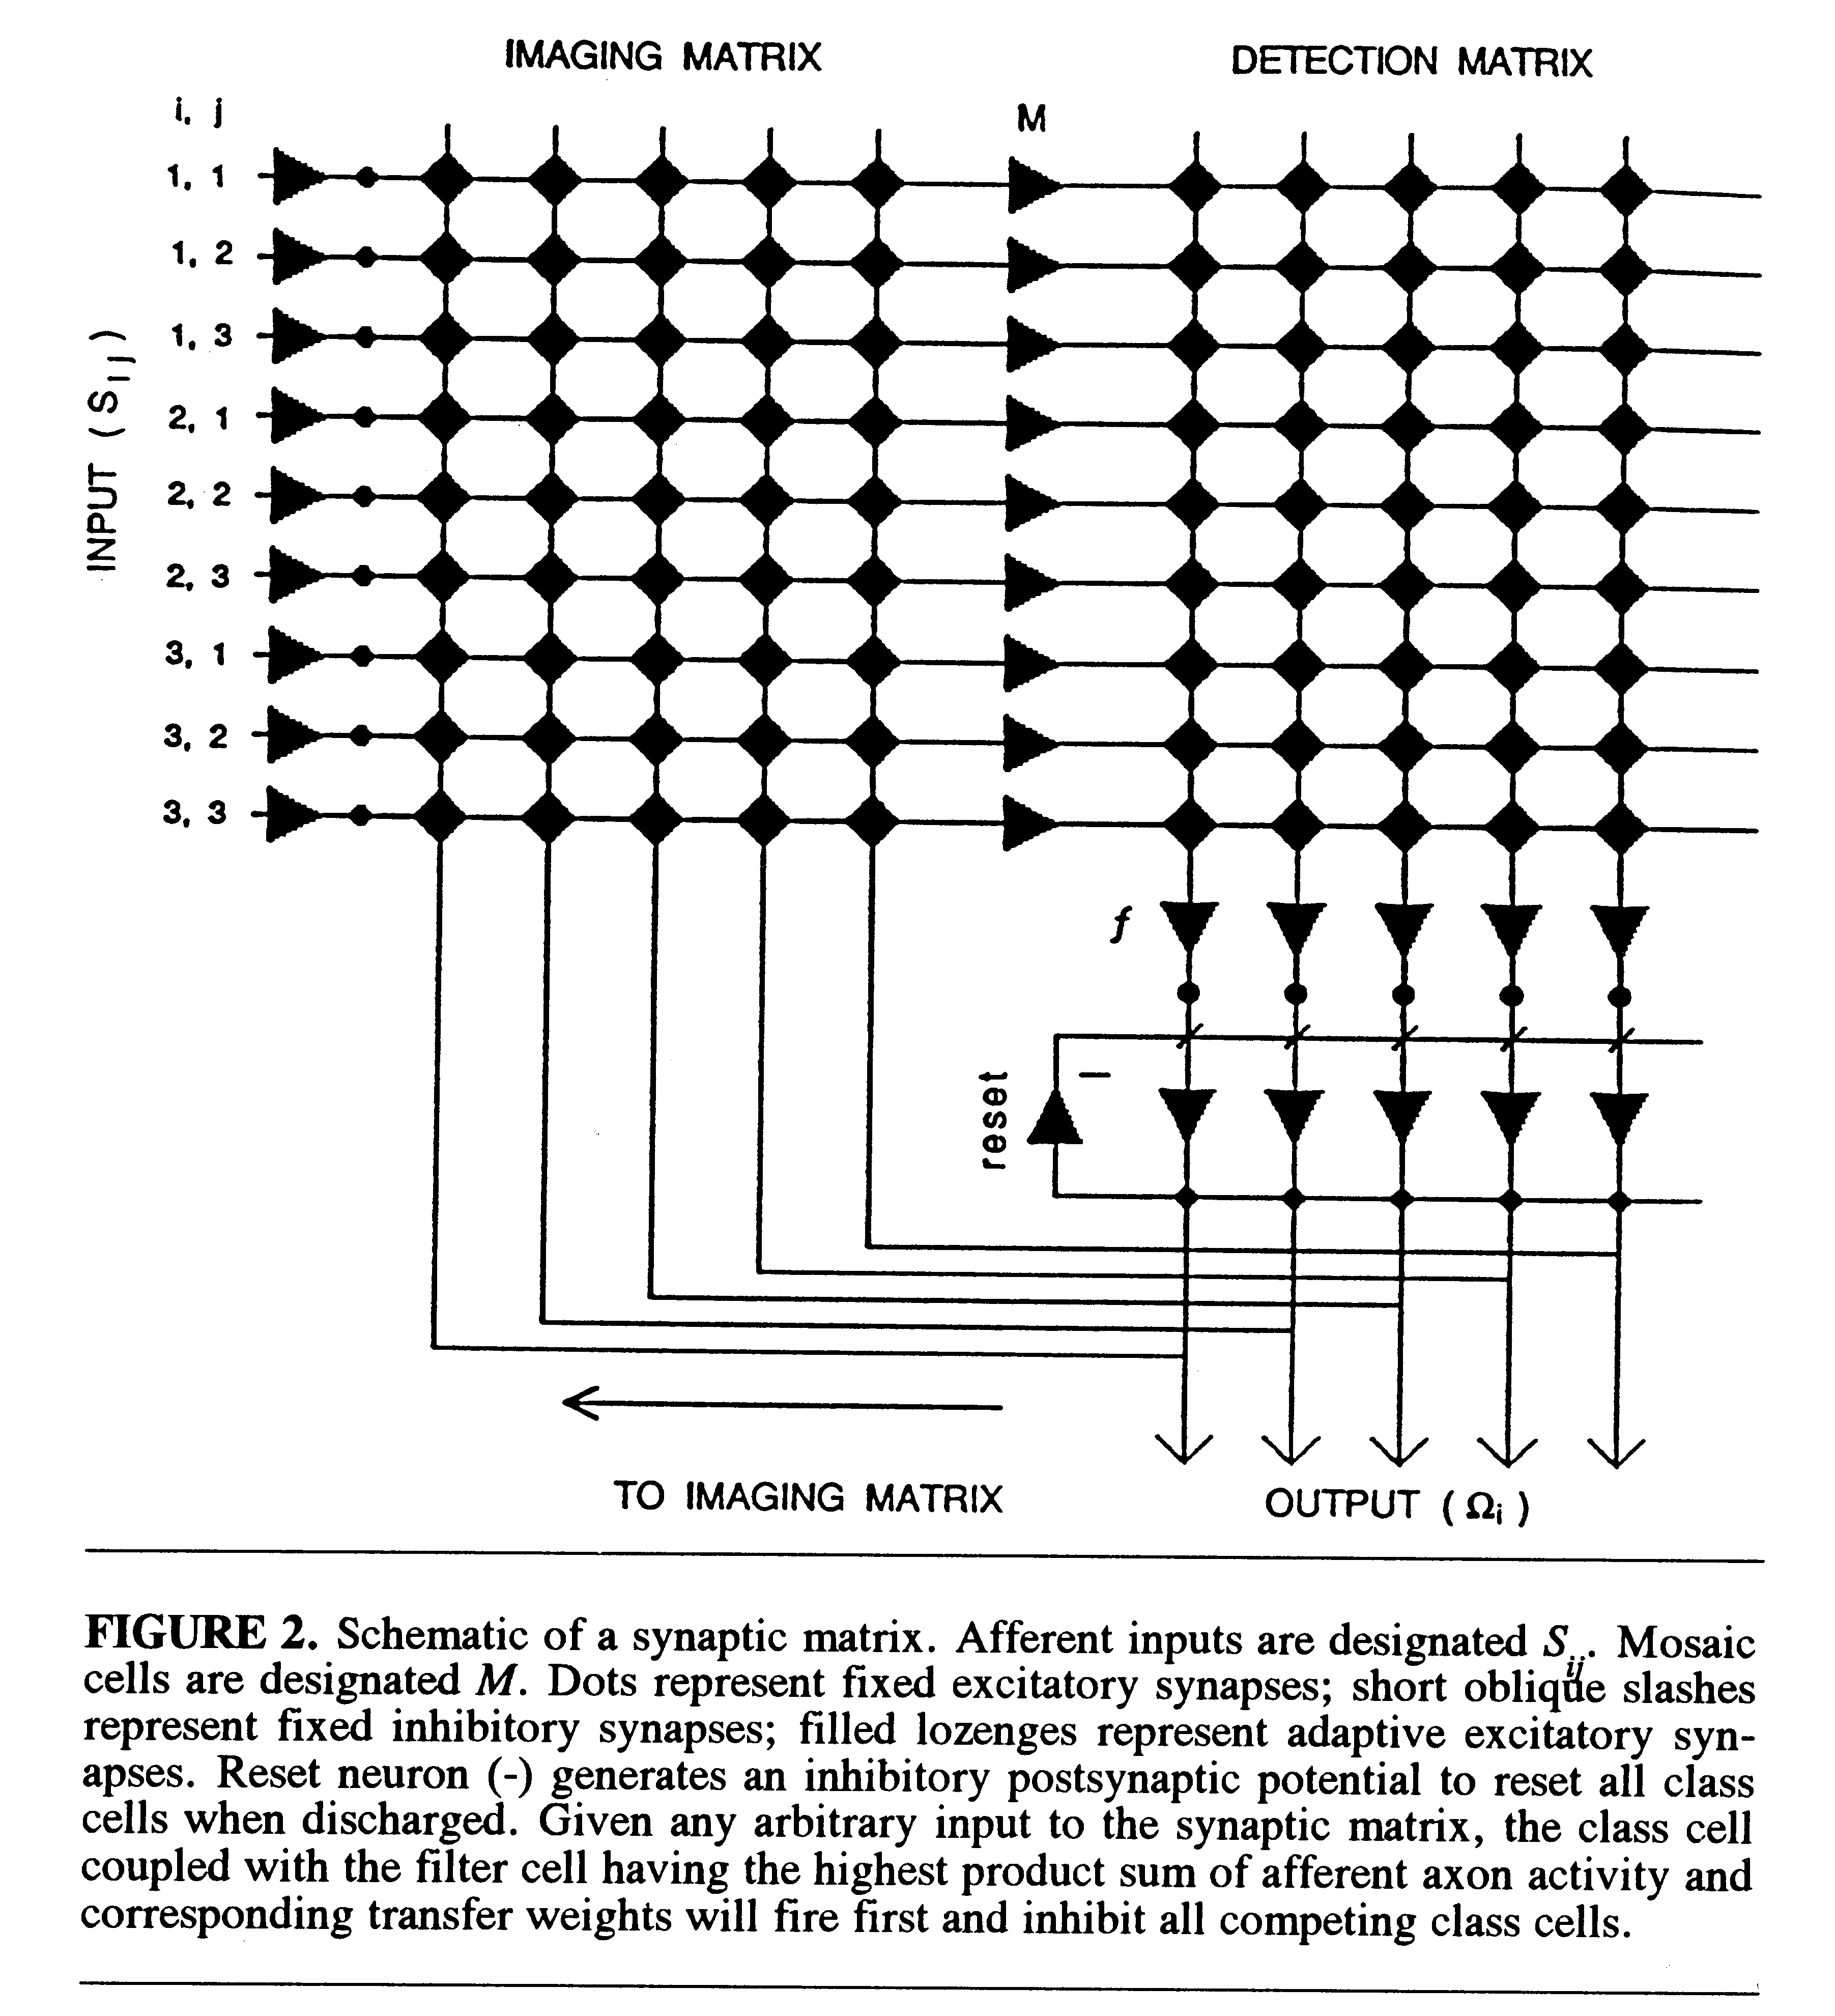
A schematic of the synaptic matrix is shown in Fig. 2. Its structural
properties and the learning rule can be briefly summarized as follows.
Retinotopic afferents Sij are in discrete
point-to-point synapse with a following set of neurons, called mosaic cells
(M ). The axon of each mosaic cell is in parallel adaptive synapse
with all members of a set of cells in the detection matrix, which are called
filter cells (f ). Each filter cell is in discrete synapse with
an output neuron called a class cell ( ). Each
class cell integrates the
activation input from its coupled filter cell. The axon of each class cell
bifurcates and sends a collateral back in adaptive synapse with the dendrites
of all mosaic cells (M ) in the imaging matrix. Finally, a reset
neuron (marked -) receives excitatory input from the axons of all class
cells () and sends its own inhibitory input back in
parallel synapse with
all class cells. Integration of filter-cell input to paired class cells,
together with the reset mechanism, ensures that the class cell that receives
the highest activation from its coupled filter cell will fire first and
inhibit all competing class cells.
). Each
class cell integrates the
activation input from its coupled filter cell. The axon of each class cell
bifurcates and sends a collateral back in adaptive synapse with the dendrites
of all mosaic cells (M ) in the imaging matrix. Finally, a reset
neuron (marked -) receives excitatory input from the axons of all class
cells () and sends its own inhibitory input back in
parallel synapse with
all class cells. Integration of filter-cell input to paired class cells,
together with the reset mechanism, ensures that the class cell that receives
the highest activation from its coupled filter cell will fire first and
inhibit all competing class cells.
One-trial learning of a visual stimulus pattern takes place by modification
of adaptive synapses on filter cells in the detection matrix and mosaic
cells in the imaging matrix. (In this simulation, processes taking place
in the imaging matrix will not be discussed.) The magnitude of learning-related
changes in synaptic transfer weight (Ø) are determined according
to the following expression.
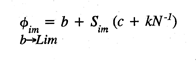
where Øim is the transfer weight of synapse
Øim , from the basal value
b -->Lim
(b ) to the saturation limit (Lim ), on an adaptive filter
cell m ; b is the initial transfer weight of the unmodified
synapse; c is a fixed synaptic contribution from the active axonal
contact on Øim ; kN -1
is a proportional synaptic contribution taking account of N coactive
axons on the cell m at the time of learning, and a synaptic modification
constant k ; and Sim is the activity
level of axonal input at Øim . The product
sum of afferent axon activity over the mosaic cell array (M ) and
the corresponding synaptic transfer weights (Ø) on each filter cell
determine its activation level.
The parameter values used in the present study for stimulus capture,
learning, and recognition of faces were the same as used in a previous
simulation of self-directed learning in a complex environment (Trehub,
1991, chapter 12).
PROCEDURE
The stimuli that were presented to the model consisted of schematic
faces (in pixel display) that had been used in previous experiments to
explore perceptual classification in humans. A subset of 10 faces taken
from the original line-drawn stimuli used in studies by Reed & Friedman
(1973) and Nosofsky (1991) were digitally scanned and reduced in size so
that each face was approximately 18 pixels in height. All 10 faces were
presented together throughout the simulation.
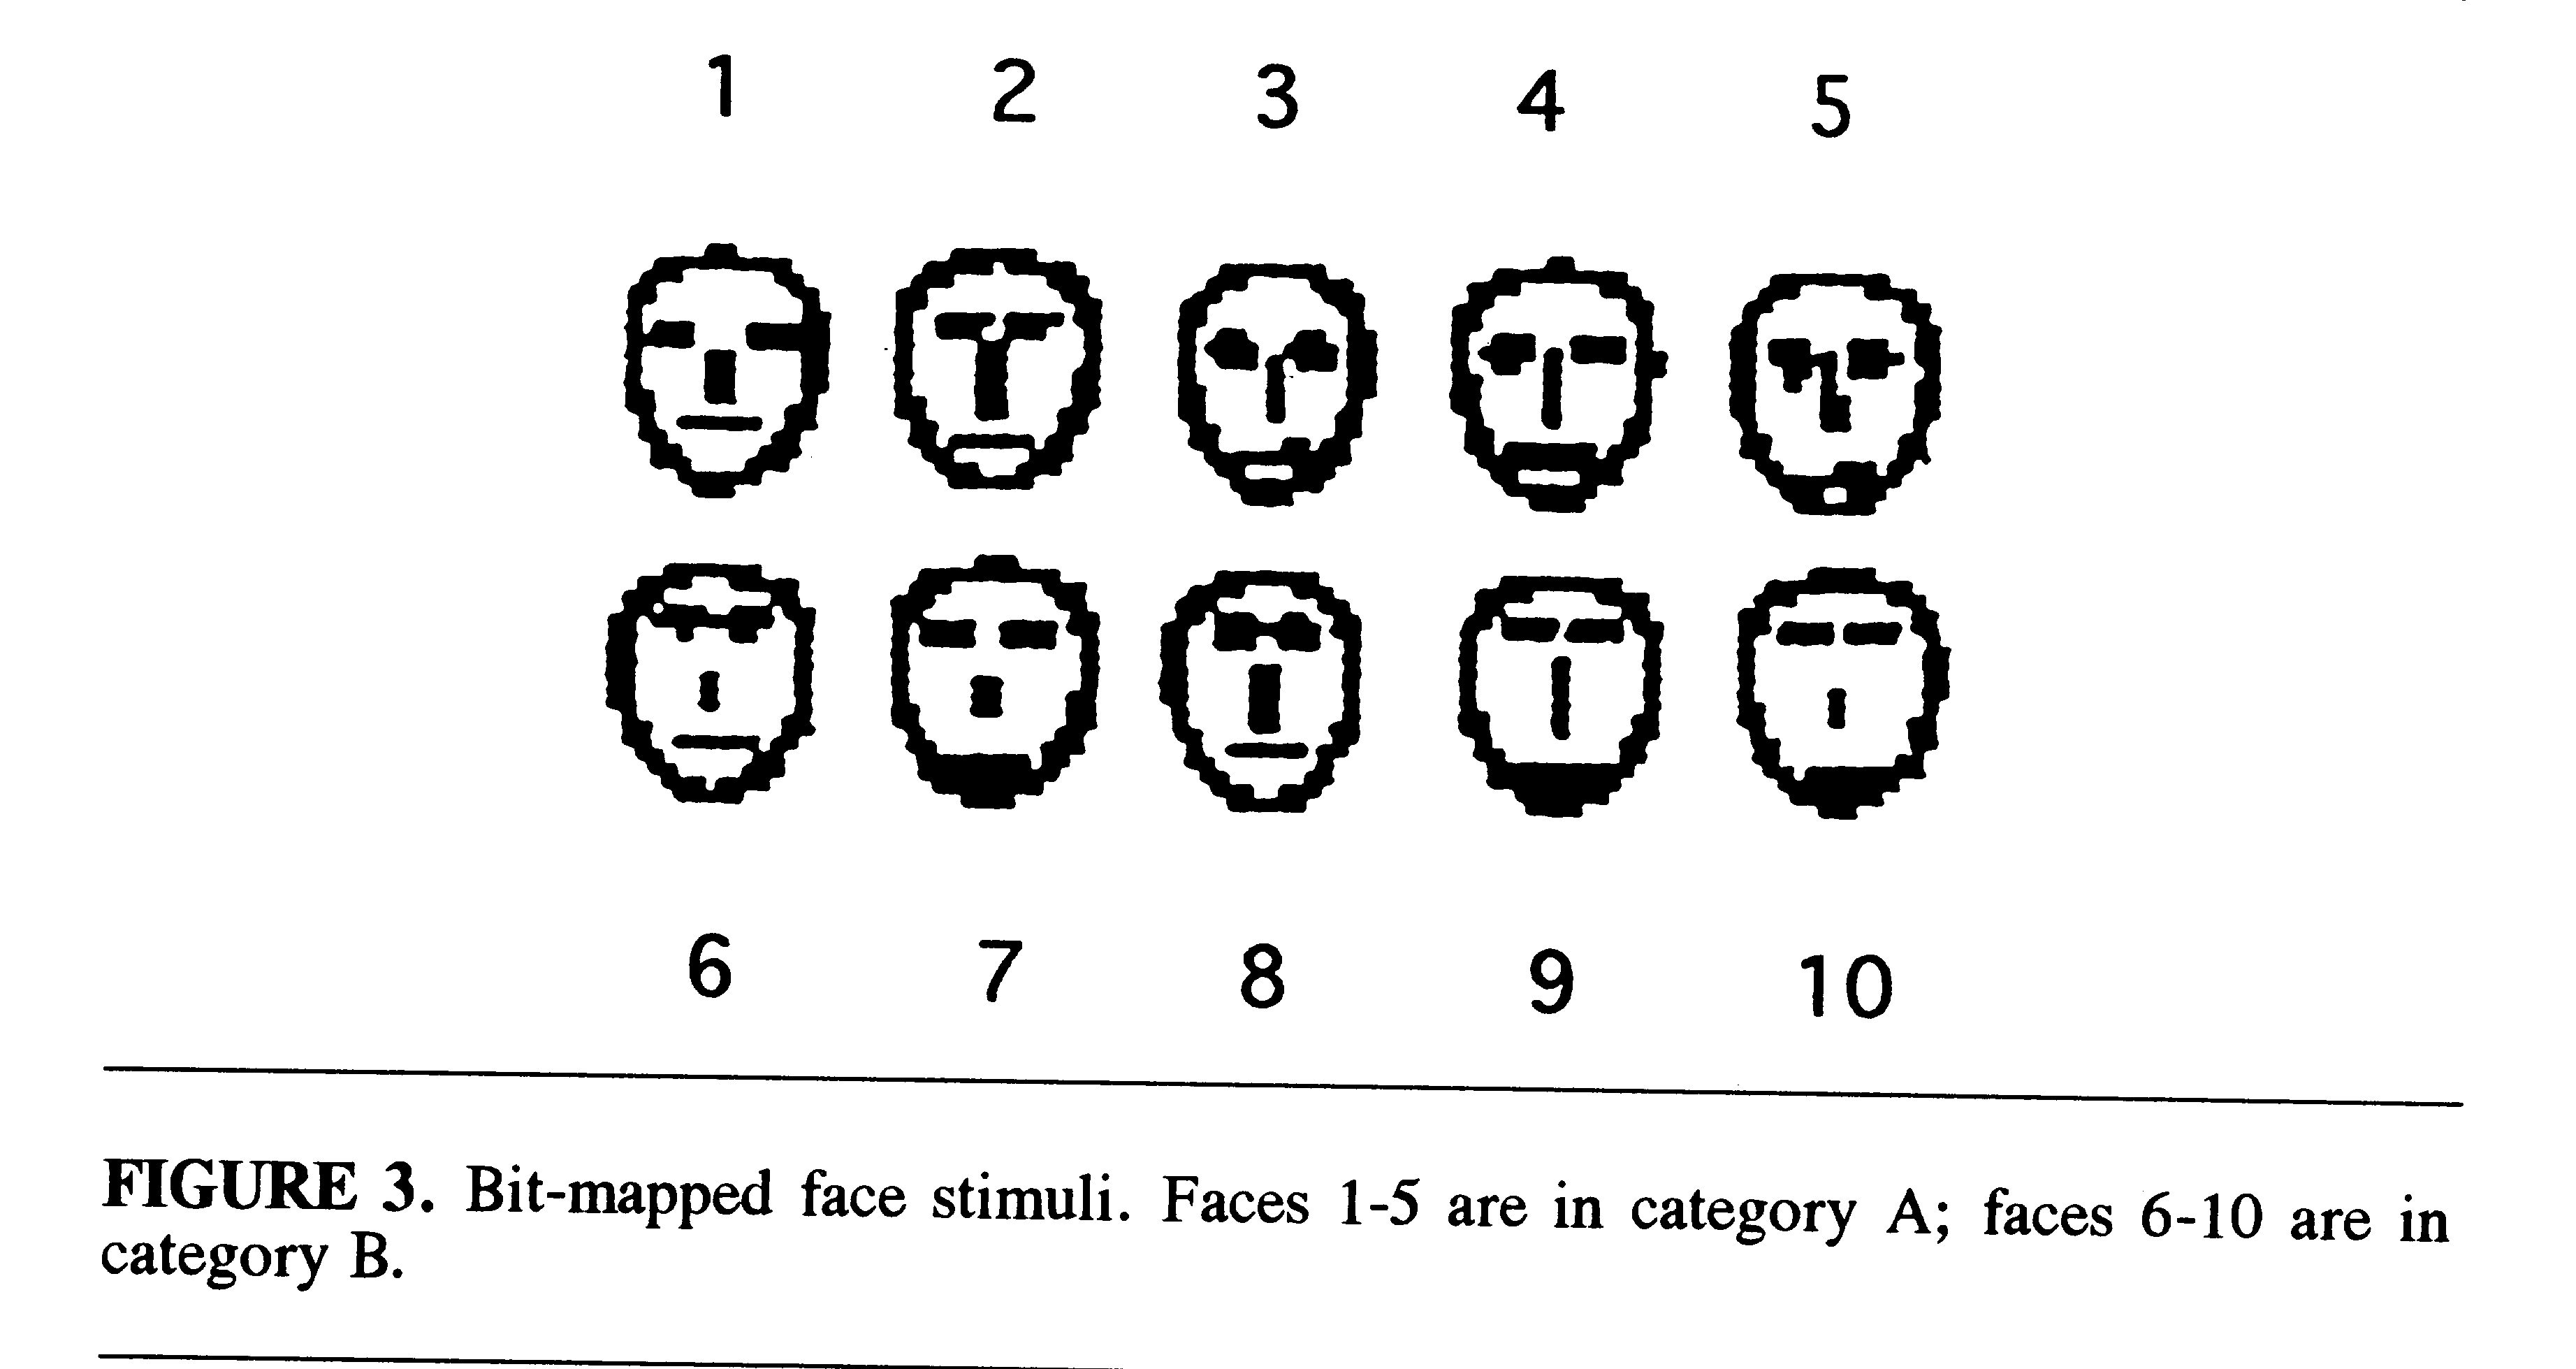
The 10 faces could be separated into 2 different categories with 5 faces
in each category on the basis of a multidimensional (MDS) analysis of eye
height, eye separation, nose length, and mouth height (Fig. 3) (Reed &
Friedman, 1973; Nosofsky, 1991). In the current study, each of the faces
was assigned an identifying name and a letter designation indicating that
it belonged to category A or B (e.g., Tim-A, Ned-B).
Before the start of the recognition procedure, synaptic transfer weights
on one filter cell (f1) in the detection set were tuned (weights
selectively increased by the learning mechanism) to a random pattern of
retinal excitation. This cell evoked the response "RANDOM" whenever it
was the most active filter cell in the detection set. On all subsequent
trials the neuronal model was presented with all 10 faces in a single display.
On each trial, the model retina automatically fixated on an individual
face in a quasi-random fashion. The task was to capture a face, report
its name (face recognition), and give its category designation. If the
response was correct, the operator typed in "YES" and another face was
captured and the procedure repeated. If the response was wrong, the operator
typed in "NO" and a previously unmodified filter cell (e.g., f2)
in the detection set was synaptically tuned to the retinal pattern of the
captured face (the current exemplar) by the intrinsic properties of the
learning mechanism. Then the operator typed in the appropriate name and
category designation which would be evoked by the model whenever f2
was the most active filter cell. Again, the system captured another
face and the same procedure was repeated. Notice that on the first recognition
trial, the only possible response that the system could make was "RANDOM",
since it had nothing else in its response repertoire. Each response to
a captured face was counted as a trial whether the response was correct
and followed immediately by a new capture, or whether it was incorrect
and resulted in the exemplar-tuned synaptic modification of another filter
cell in the detection set (learning). The simulation proceeded until 400
trials were completed. Performance was examined for face recognition and
category designation in each of 16 sequential blocks of 25 trials for each
block.
RESULTS
Face Recognition and Categorization. Figure 4 shows the learning
curves over all blocks. The percentage of correct responses for both face
recognition and categorization was characterized by a curve with an initial
rapid rise over the first 50 trials followed by deceleration of improvement.
The categorization response improved more rapidly than did the recognition
of individual faces . At the end of the 400 trials, correct performance
for both recognition and categorization was at the 96% level.
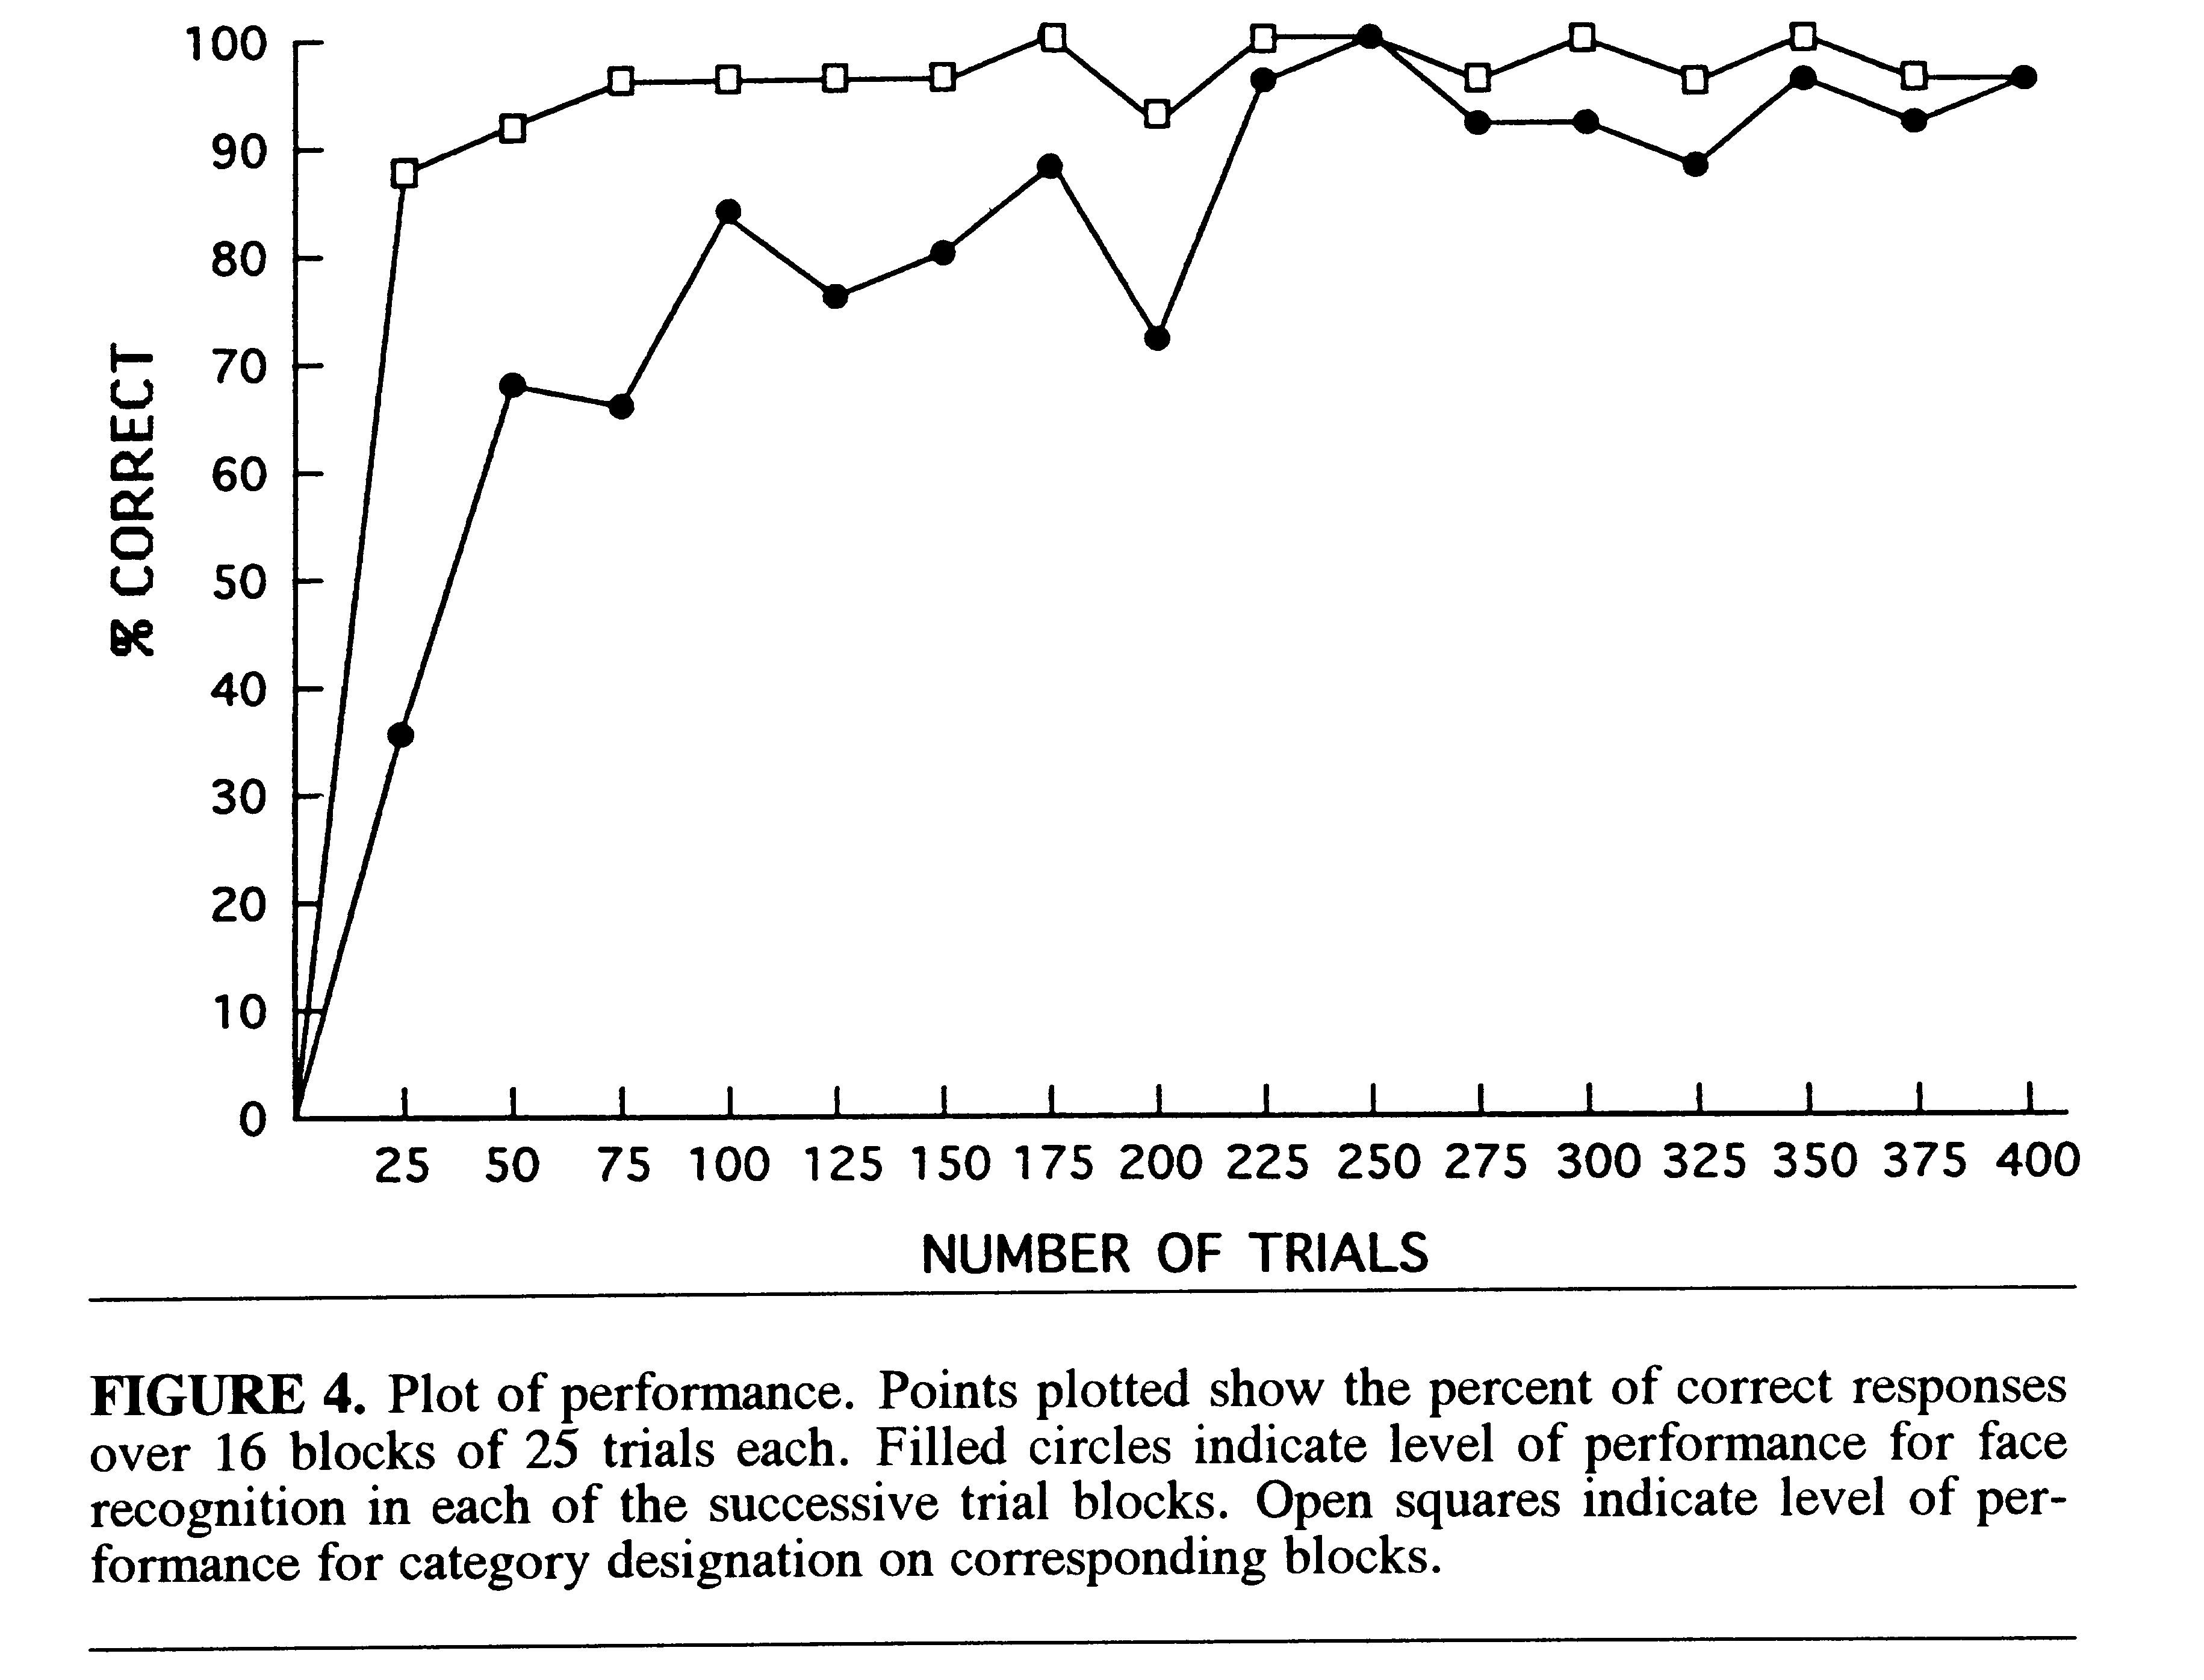
The conclusion that categorization of faces improved more rapidly than
the recognition of individual faces was based on the following considerations.
In the simulation, a correct identification of a face also evokes its correct
category. Only those trials where the identification response was wrong
could provide information about the rate of category learning (cat) relative
to the rate of recognition learning (rec). Since two categories of faces
(A and B) were presented, there was a 50% chance that a wrong identification
response would nevertheless name a face in the correct category. Hence
on each block of trials we would expect a relative advantage for category
performance on the basis of chance alone. Only if the magnitude of the
advantage were greater than expected by chance could we conclude that categorization
improved more rapidly than recognition. Thus in order to determine if the
rate advantage for categorization was significantly greater than chance
expectation, the following formula was applied on each block of trials.
Expected Advantage [cat] = % Correct [rec] + (100 - % Correct [rec])/2
The differences between the observed percentage of correct categorization
and the Expected Advantage [cat] over all 16 blocks of 25 trials provided
the data on which to assess the rate of improvement in categorization.
There was an unbiased advantage for categorization ranging from +20% on
block 1 to +6% on block 8. Over the last eight blocks, the categorization
advantage ranged from +4% to 0%. A total of 70 filter cells in the detection
set had been synaptically tuned by the learning mechanism to exemplars
of the captured faces. All filter cells exhibited broad tuning curves over
the faces that were captured. This is illustrated in Figs. 5 and 6 where
the activation levels of 10 different filter cells are shown in response
to each of the 10 faces. These were randomly selected from the cells that
signalled the correct response in a sample drawn from the last 50 trials
in which 10 different faces were captured.
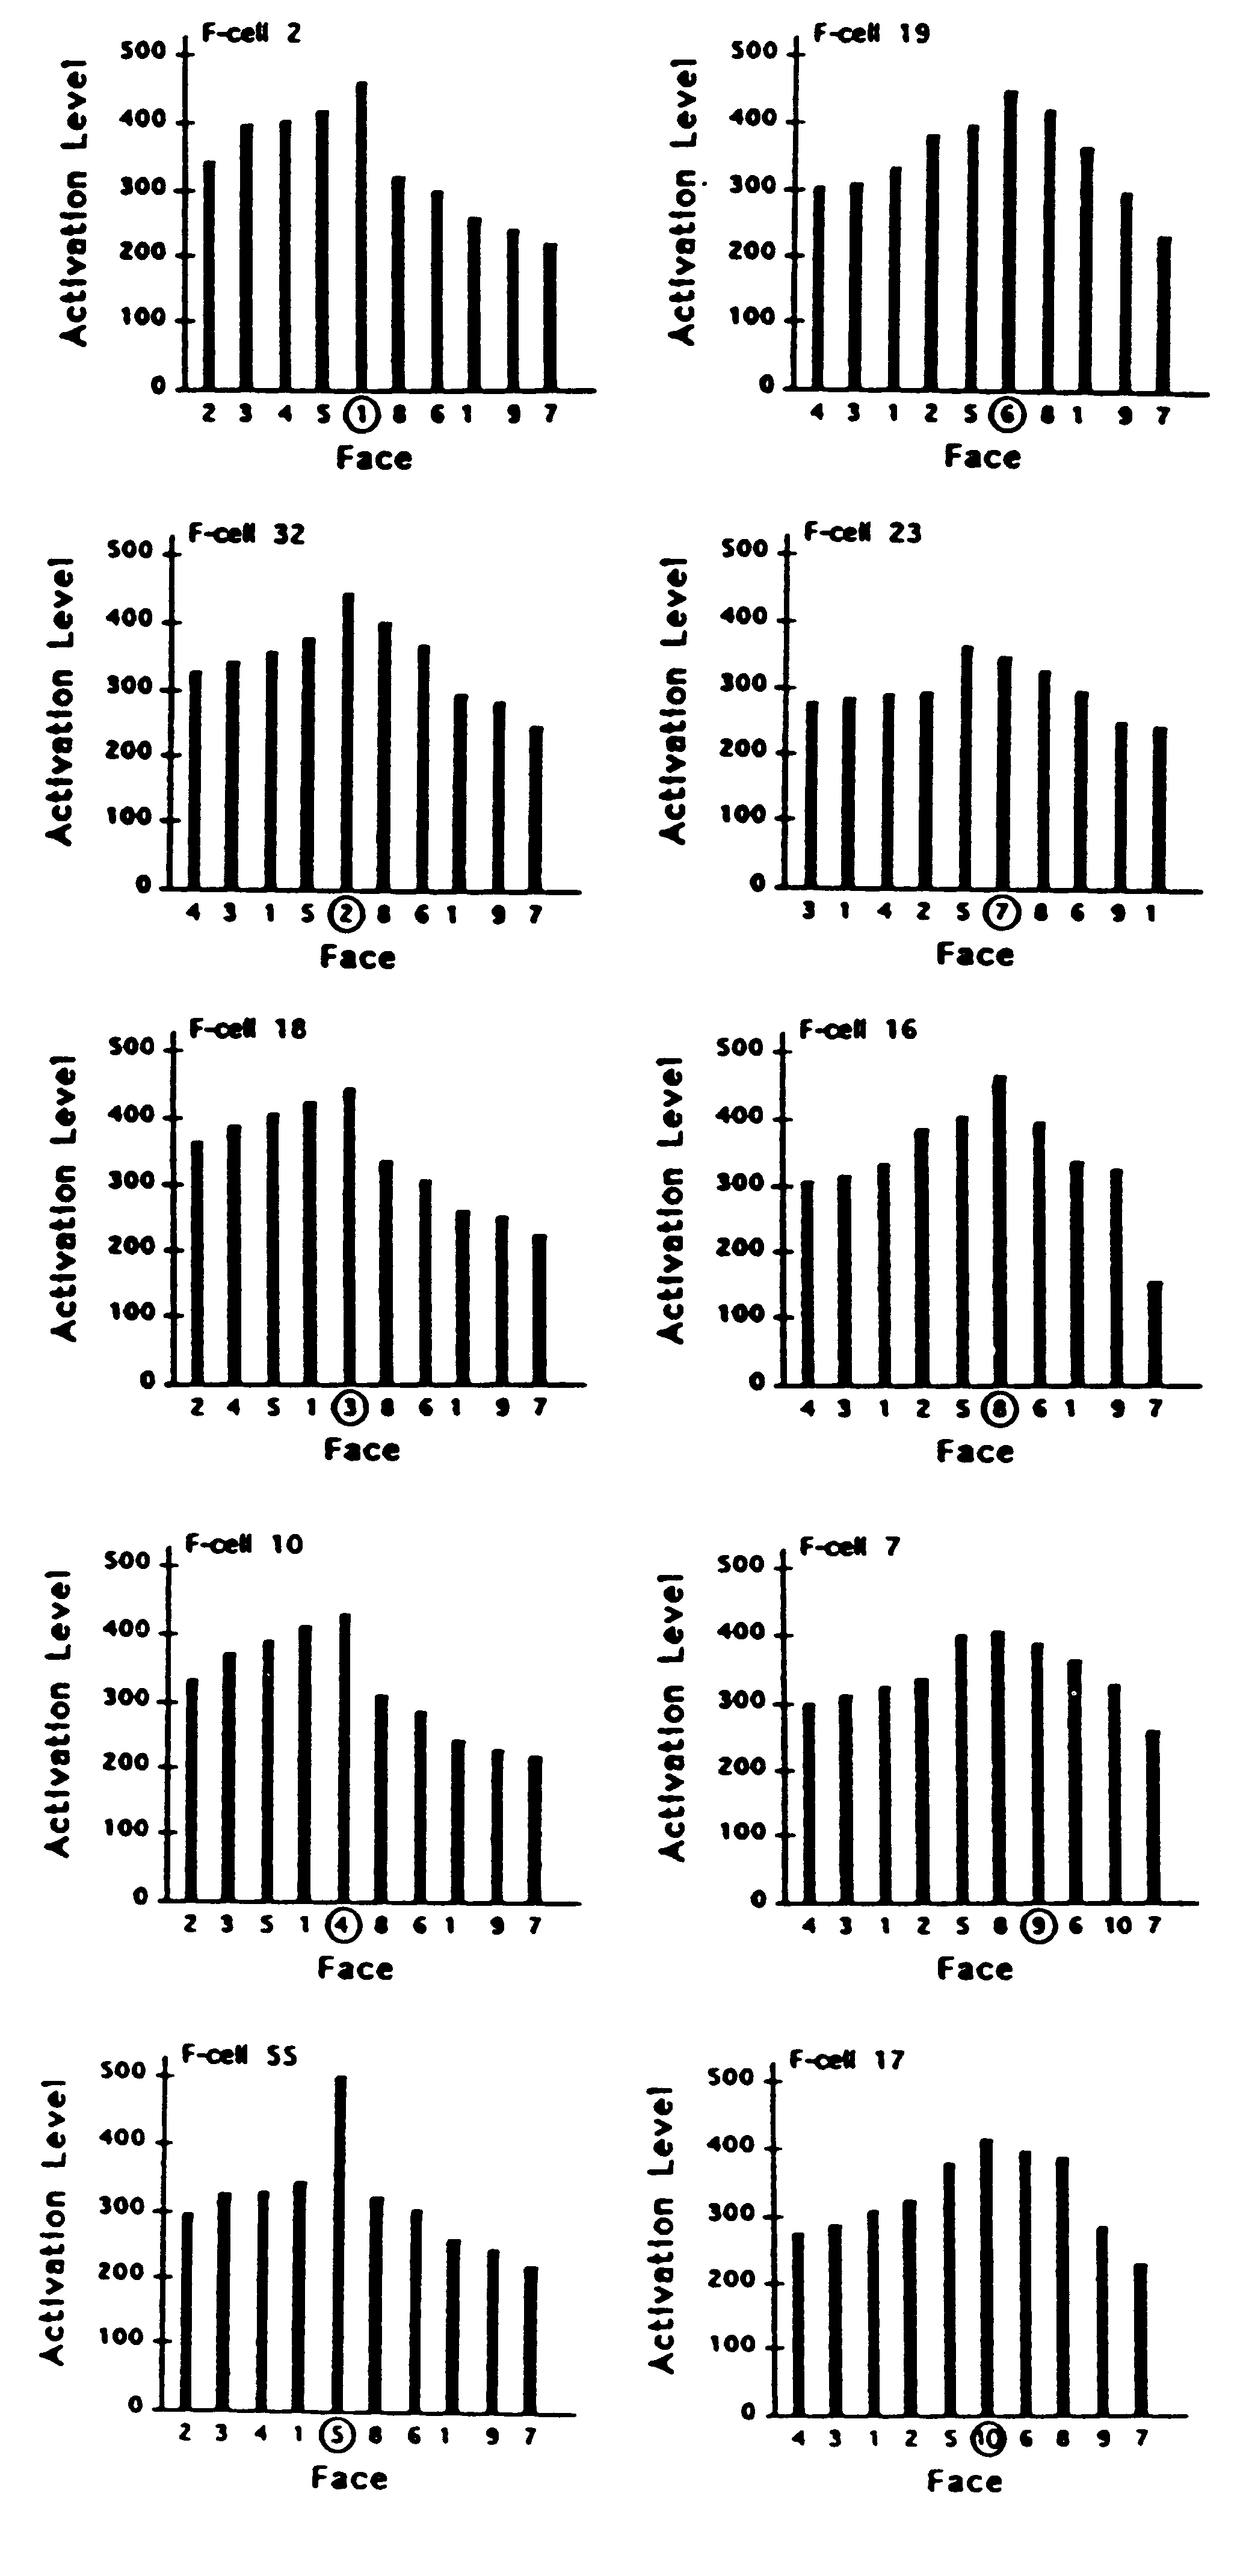
Figure 5. Activation levels of each of 10 sampled filter cells
(F-cells) in response to exemplars of each of the 10 face stimuli. Activation
response of each F-cell plotted against each face. Each F-cell in the left
column had been synaptically tuned during learning to one of the 5 faces
in category A. Each F-cell in the right column had been tuned to one of
the 5 faces in category B. For each cell, the face that it had learned
is indicated by being circled. In each of the 10 plots, faces in category
A are ordered so that the level of F-cell activation evoked by each face
grades down to the left of the distribution; faces in category B are ordered
so that the activation they evoked grades down to the right of the distribution.
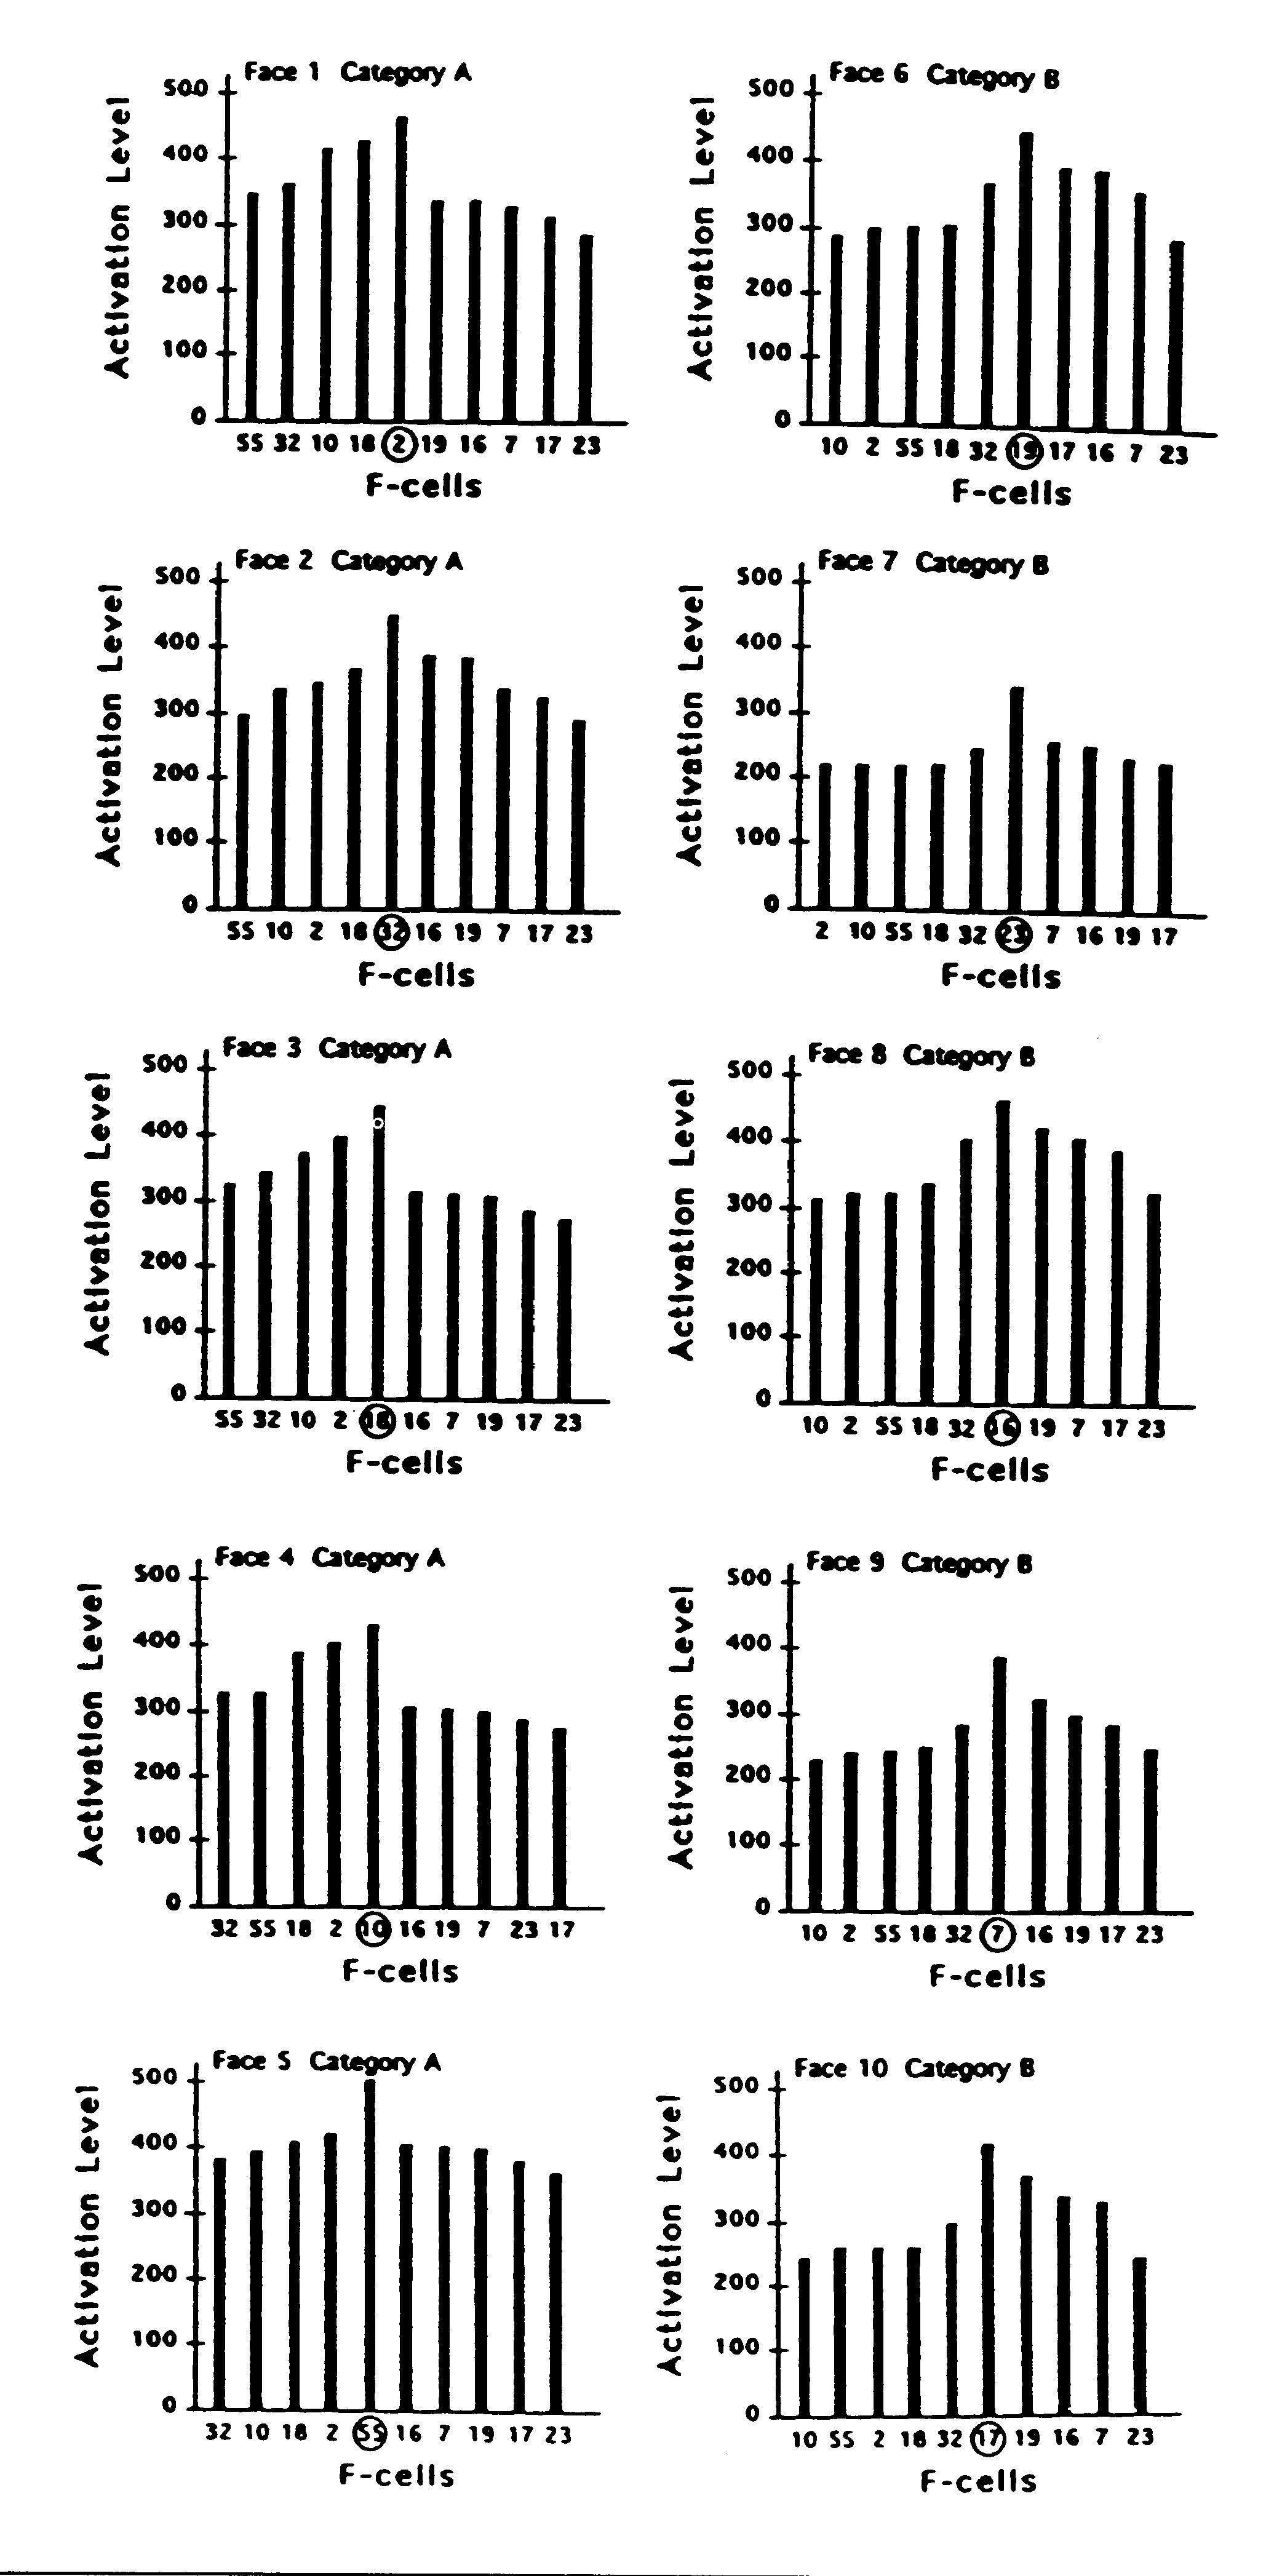
Figure 6. Activation evoked by each face plotted against each
F-cell. For each face, the cell that had learned it is indicated by being
circled. Cells that had learned faces in category A are ordered so that
their response levels grade down to the left; cells that had learned faces
in category B are ordered so that their response levels grade
down to the right.
Cell Response Profiles. On each trial, the neuronal model selects
a discrete recognition response on the basis of competitive activity among
cells. The filter cell with the highest activation level evokes its associated
name for the face that has been captured while inhibiting the output effects
of all other cells. It is important to notice that a filter cell that has
been selectively tuned to a particular face can exhibit a stronger response
to other faces. This will not degrade the effectiveness of the recognition
system as long as the response of the correct cell is higher than any other
cell in the detection set at the time that its learned exemplar or a pattern
most similar to it is captured. For example, it can be seen in Fig. 5 that
F-cell 7 gives a stronger response on the trials in which faces 5 and 8
were captured than on the trial in which face 9 (the face it had learned)
was captured. Yet, as Fig. 6 shows, the response of F-cell 7 to the capture
of face 9 is stronger than any of its competing filter cells when face
9 is the effective stimulus.
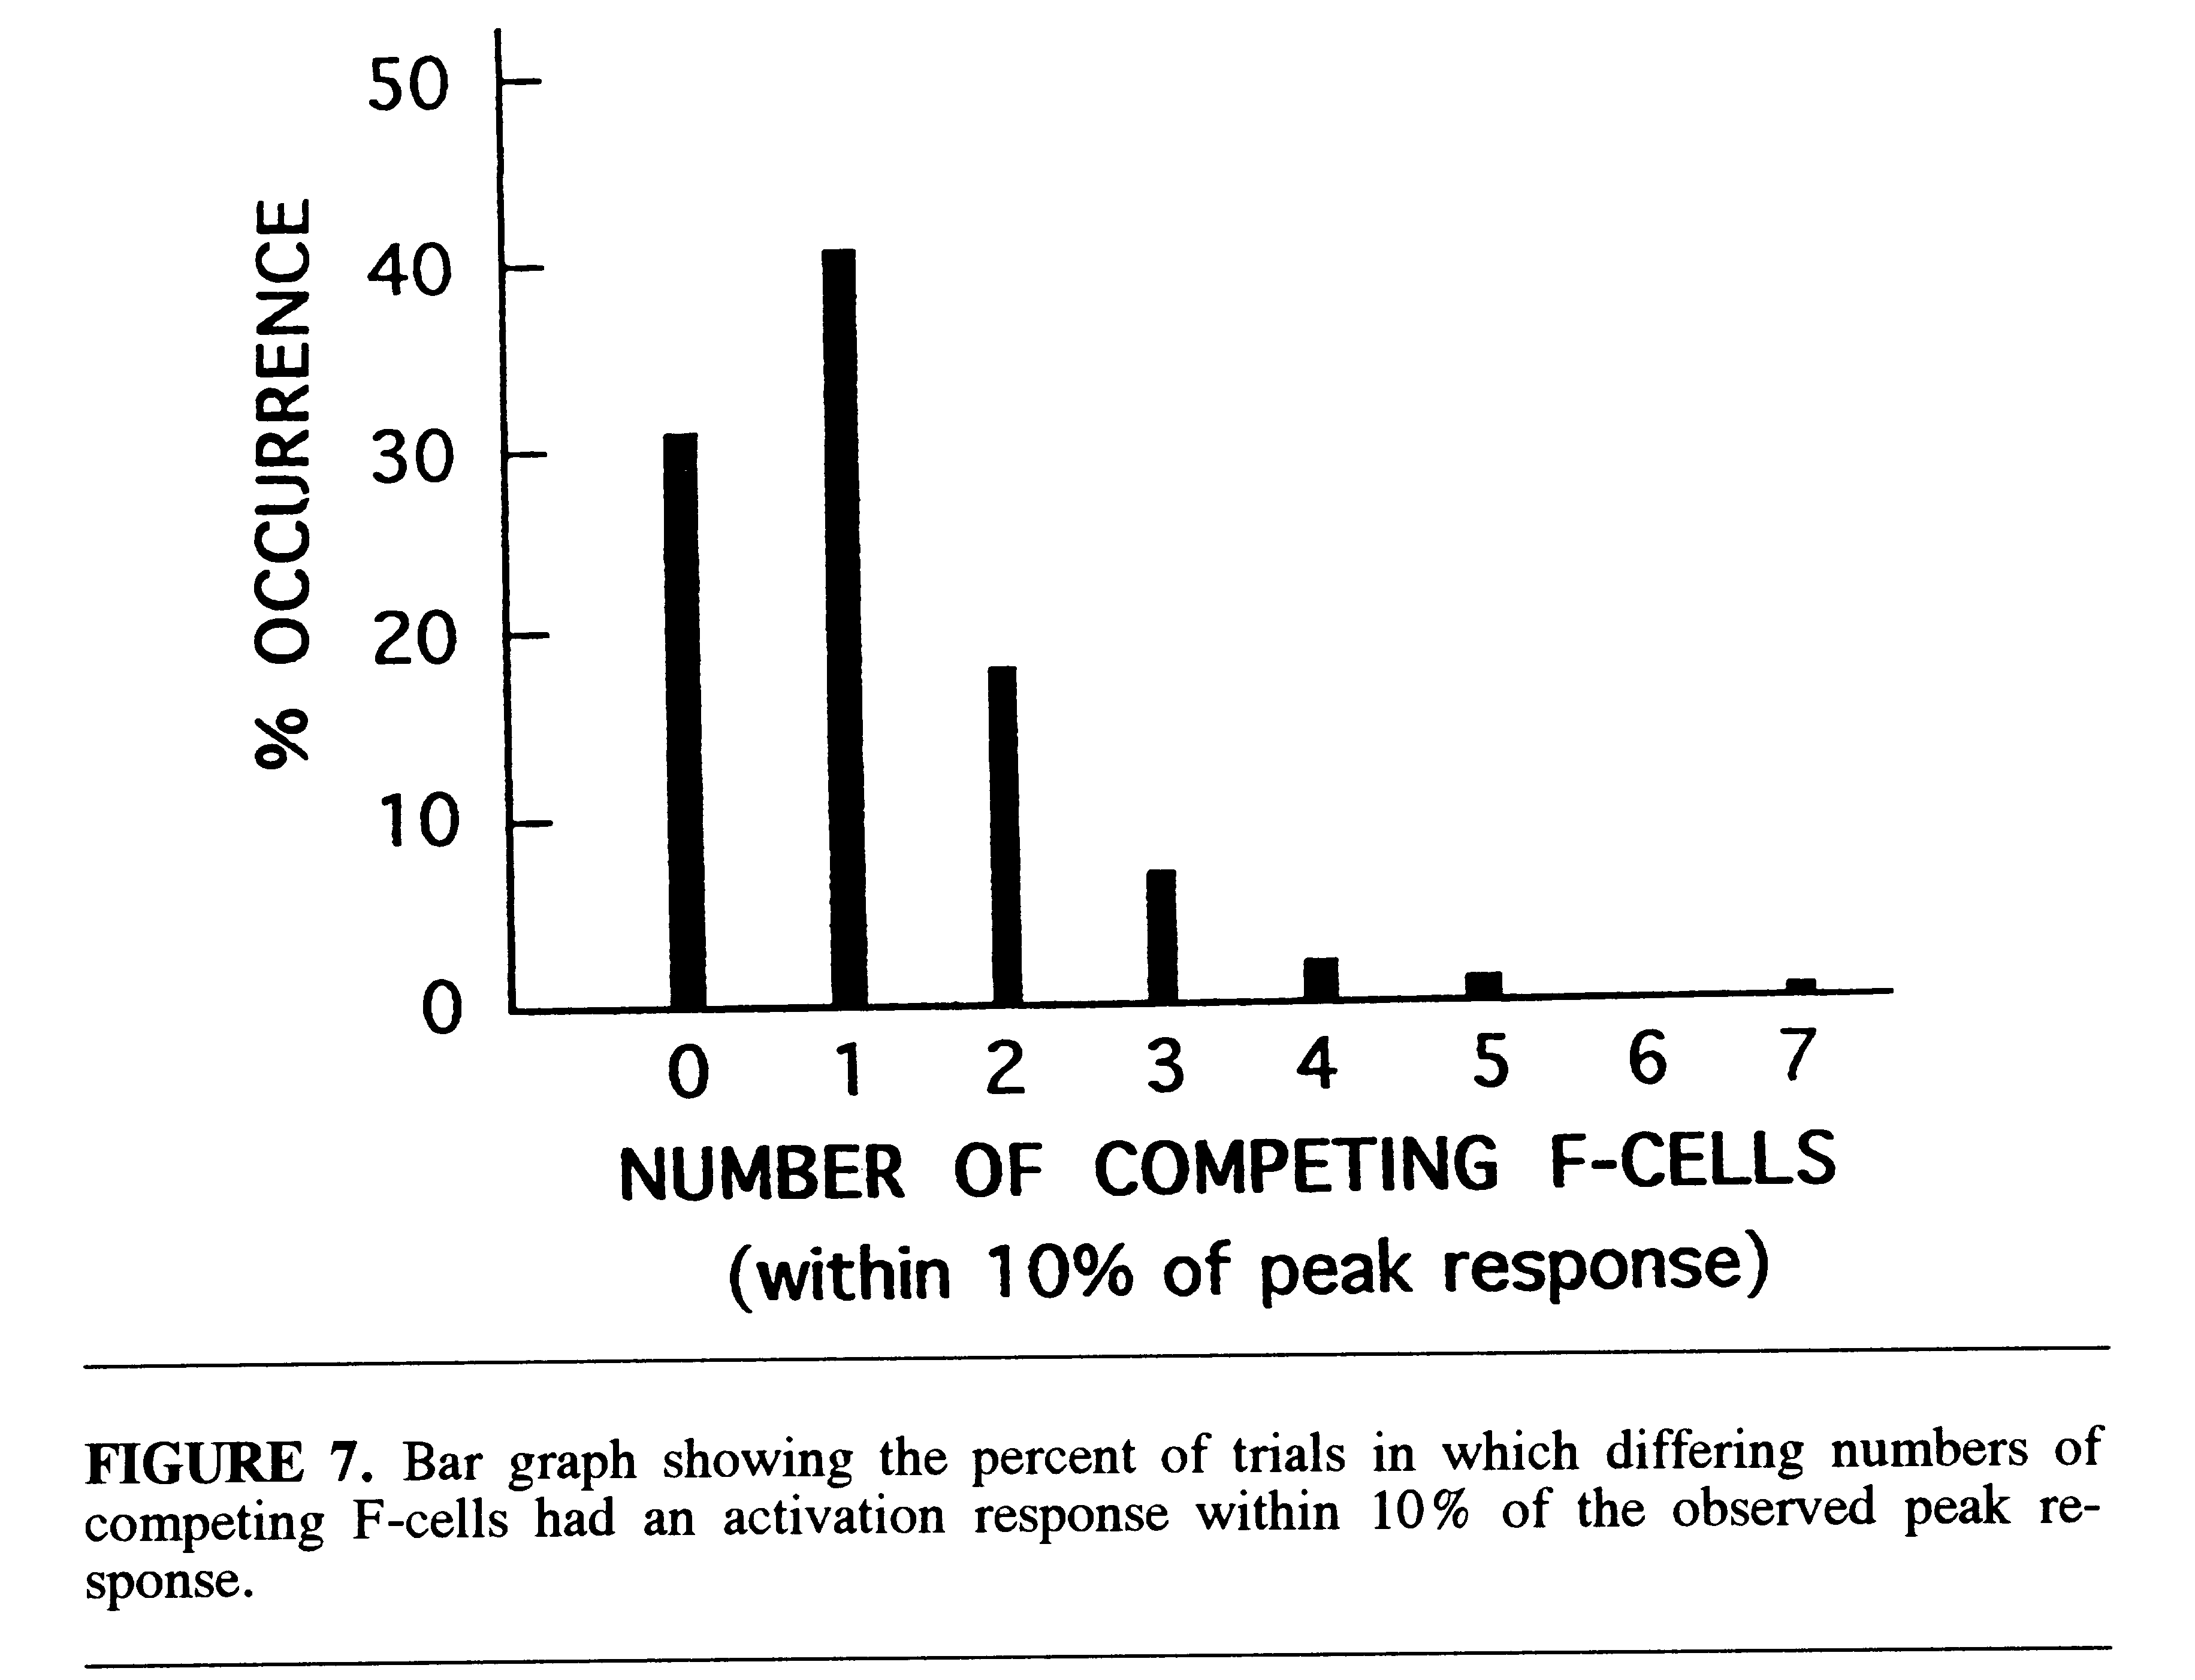
The overall selectivity of the recognition system can be characterized
by the number of competing filter cells which approach the peak activation
level on each trial in which there is a correct response. This is illustrated
in Fig. 7 which shows the distribution of the number of competing cells
with activation levels within 10% of the peak on all correct trials. It
was found that on 31% of the trials there was no competing cellular activity
within 10% of the peak response. On 41% of the trials there was only one
competing cell within this range. The general shape of the selectivity
distribution is similar to the reported distribution of discrepancies between
population vectors (ensembles) of unit reponses in cells of the macaque
inferotemporal cortex and corresponding stimulus (face) vectors (Young
& Yamane, 1992).
IMPLICATIONS
It is clear from these results that filter cells exhibit a graded response
to all faces and therefore do not exhibit a punctate code. This finding
is consistent with some kind of sparse coding mechanism for face recognition.
However, the question of how sparse coding is used to ensure reliable recognition
is more problematic. It is commonly proposed that a sparse population code
entails the joint activity of a relatively small number of cells
(an ensemble), each making its own necessary contribution to the set of
encoded features which, taken together, characterize an individual face
(Baylis, Rolls, & Leonard, 1985; Gross, 1992; Gross & Sergent,
1992; Young & Yamane, 1992). Similarly, in the more general context
of object recognition, it has been suggested that objects are coded by
sparse combinations of active cells where each cell represents the presence
of a particular complex partial feature of the object (Tanaka, 1993; Tanaka,
Saito, Fukada, & Moriya, 1991). Let us call this kind of code sparse-code
1. This approach to the problem of object recognition postulates a
structure of overlapping feature detectors (mini-templates) in the visual
system that are assumed to be distributed in replicated fashion over the
visual field. The critical notion is that each stack of feature detectors
(putatively in columnar organization) is tagged by its retinotopic location
so that a complete object can be uniquely defined by the whole concurrent
activation pattern of a set of particular detectors at their particular
locations. However, a caution must be raised here. If, at any given moment,
there is only one object in the visual field, then an activated set of
spatially indexed features might provide a unique definition of that single
object. But what if there is more than one object in the visual field,
as is normally the case in the natural world? Under the normal circumstance,
we would need a biologically plausible mechanism that is able to map our
complex retinal activation patterns onto just those discrete groups of
spatially-indexed feature detectors that correspond to each of the separate
objects in view (the binding problem). This is not a trivial problem. Indeed,
it remains one of the serious obstacles for the general class of pattern
recognizers based upon the principle of detecting and combining partial
features.
An alternative interpretation of sparse coding is suggested by the operating
characteristics of the neuronal model (Trehub, 1991) that generated the
results obtained in the present simulation study. In this model, when a
face is captured within the visual afferent aperture, all filter cells
show increased activation, but the cell with the highest activation level
in response to the current retinal (proximal) stimulus evokes the appropriate
discrete output. Hence, for each proximal stimulus a single cell can generate
a code precise enough for effective recognition (Barlow, 1972, 1985; Konorski,
1967; see also Konishi, 1991). The joint contribution of other coding cells
is not required.
If this is the case, why did effective performance in the present simulation
require that more than 10 filter cells be synaptically tuned to learn 10
faces? The answer is revealed in the difference between the distal (environmental)
and the proximal (retinal) stimulus. When a face is in the visual field,
we do not know exactly where its features will be registered on the retina.
At one time, fixation might be centered on the upper part of a given face;
at another time on a lower part of the same face. The features of a constant
distal stimulus may excite differing proximal patterns on the retina at
different times. Variations in fixation of no more than 1 degree in visual
angle can result in significant changes in the distribution of foveal excitation.
Each retinal pattern represents only an exemplar of a given stimulus. Some
exemplars may vary from previously learned patterns to the extent that
they exceed the capacity of the recognition system to generalize correctly
. Thus effective recognition of a face (or any other complex pattern) requires
that different cells be tuned to at least a few different exemplars of
the face in order to facilitate proper generalization and compensate for
fortuitous shifts in exemplar capture (Trehub, 1991). In this sense, the
sub-population of exemplar-tuned cells that individually signal
a particular face also constitute a sparse code for that face. Notice,
however, that this code is significantly different from sparse-code 1 in
that it does not require the joint activation of an ensemble of
exemplar-tuned cells to achieve effective recognition. Let us call this
kind of neuronal code sparse-code 2.
The characteristic strategy for investigating selective coding of faces
(or other objects) in neurophysiological experiments has depended on finding
cells in which the peak spike rate is systematically evoked by the presentation
of particular faces in an arbitrary set of stimuli (Desimone et
al, 1984; Perrett, Mistlin, & Chitty, 1987; Young & Yamane,
1992; see also Tanaka et al, 1991; Gallant, Braun, & Van Essen,
1993). Implicit in this strategy is the general assumption that if the
output of a cell is to be a reliable indicator of a particular object,
the cell must respond more vigorously when that object is seen than when
any other object is seen. This investigatory approach precludes the possibility
of uncovering a neuronal recognition mechanism based upon competitive discrimination
by sparse-code 2. For example, under the usual paradigm, F-cell 7 in the
present simulation (Figs. 5 and 6) would be thought to more likely code
for face 5 or face 8 than for face 9, which it actually learned and correctly
recognized within the competitive recall model (Trehub, 1977, 1991).
If the neuronal brain mechanism for face recognition in the monkey is
organized on the principle of sparse-code 2 then several implications for
the interpretation of single-cell recordings follow: (1) broad tuning of
many cells in response to a particular face (or any other complex pattern)
does not straightforwardly imply an ensemble code; (2) discovering a set
of exemplar-tuned cells requires that we record the concurrent responses
of a large number of cells to many presentations of each face (the distal
stimulus) in the stimulus set because the retinal pattern (the proximal
stimulus) that is captured is likely to vary over time even for identical
faces as a result of shifts in fixation; (3) given the effect of variation
in fixation, it would be helpful for the interpretation of results to monitor
fixation throughout an experiment; (4) the critical indicator of selective
coding is not the relative spike rate of a cell in response to different
stimuli, but rather the rate of its output relative to other cells responding
at the same time.
REFERENCES
Barlow, H. B. (1972). Single units and sensation: A neuron doctrine
for perceptual psychology? Perception, 1, 371-394.
Barlow, H. B. (1985). The twelfth Bartlett memorial lecture: The role
of single neurons in the psychology of perception. Quarterly Journal
of
Experimental Psychology , 37A, 121-145.
Baylis, G. C., Rolls, E. T., & Leonard, C. M. (1985). Selectivity
between faces in the responses of a population of neurons in the cortex
in the superior temporal sulcus of the monkey. Brain Research ,
342, 91-102.
Bruce, V., Cowey, A., Ellis, A. W., & Perrett, D. I., Eds. (1992).
Processing the facial image. Philosophical Transactions of the Royal
Society of London. B , 335, 1-128.
Desimone, R., Albright, T. D., Gross, C. G., & Bruce, C. (1984).
Stimulus-selective properties of inferior temporal neurons in the macaque.
Journal of Neuroscience , 4, 2051-2062.
Gallant, J. L., Braun, J., & Van Essen, D. C. (1993). Selectivity
for polar, hyperbolic, and cartesian gratings in macaque visual cortex.
Science , 259, 100-103.
Gross, C. G. (1992). Representation of visual stimuli in inferior temporal
cortex. Philosophical Transactions of the Royal Society of London. B
,
335, 3-10.
Gross, C. G., Rocha-Miranda, C. E., & Bender, D. B. (1972). Visual
properties of neurons in inferotemporal cortex of the macaque. Journal
of Neurophysiology , 35, 96-111.
Gross, C. G. & Sergent, J. (1992). Face recognition. Current
Opinion in Neurobiology , 2, 156-161.
Konishi, M. (1991). Deciphering the brain's codes. Neural Computation
, 3,
1-18.
Konorski, J. (1967). Integrative activity of the brain . University
of Chicago Press.
Kosslyn, S. M. & Mumford, D., Eds. (1991). Special issue on face
perception. Journal of Cognitive Neuroscience , 3, 1-88.
Nosofsky, R. M. (1991). Tests of an exemplar model for relating perceptual
classification and recognition memory. Journal of Experimental
Psychology: Human Perception and Performance , 17, 3-27.
Perrett, D. I., Mistlin, A. J., & Chitty, A. J. (1987). Visual cells
responsive to faces. Trends in Neuroscience , 10, 358-364.
Reed, S. K. & Friedman, M. P. (1973). Perceptual vs. conceptual
categorization. Memory & Cognition , 1, 157-163.
Tanaka, K. (1993). Neuronal mechanisms of object recognition. Science
, 262, 685-688.
Tanaka, K., Saito, H., Fukada, Y., & Moriya, M. (1991). Coding visual
images of objects in the inferotemporal cortex of the macaque monkey. Journal
of Neurophysiology , 66, 170-189.
Trehub, A. (1977). Neuronal models for cognitive processes: Networks
for learning, perception and imagination. Journal of Theoretical Biology
, 65, 141-169.
Trehub, A. (1991). The cognitive brain . Cambridge: MIT Press.
Young. M. P. & Yamane, S. (1992). Sparse population coding of faces
in the inferotemporal cortex. Science , 256, 1327-1331.