Deecke, Luder.,
Lang, W., Beisteiner, R., Uhl, F., Lindinger, G & Cui, R.Q (1998)
Experiments in Movement Using DC-EEG, MEG, SPECT and FMRI.
(Proceedings of the International Symposium on Brain Mapping Oiso/Japan 13-15 Sept
1996)
In: Current Progress in Functional Brain Mapping - Science and Applications.
London. Smith-Gordon & Co Ltd. pp. 53-60
EXPERIMENTS IN MOVEMENT USING DC-EEG, MEG, SPECT AND FMRI
L. Deecke, W. Lang, R. Beisteiner, F. Uhl, G. Lindinger and R.Q.
Cui
University Clinic of Neurology and Ludwig Boltzmann Institute for
Functional Brain Topography
Währinger Gürtel 18-20, A-1090 Vienna, Austria
Our volitional self-initiated acts are preceded by the Bereitschaftspotential
(BP) or readiness potential [34,35]. The BP has an early component (BP1)
and a late component (BP2, see Fig. 1). The early component BP1 lasts from
the very beginning of the BP (1-2 s or more prior to movement onset depending
on the complexity of the movement) to app. ½ s prior to movement
onset and the late component BP2 lasts from ½ s before to the onset
of movement itself (s 0 in Fig. 1). BP1 is symmetrical even for unilateral
movement, while BP2 is larger over the contralateral hemisphere.
DC-EEG
Electroencephalography originally was the only method fast enough to
record movement-related cortical events. Attempts to record movement-related
potentials date back to as early as 1951, when Bates [6] probed into the
pre-movement period using a cathode-ray oscilloscope on a photographic
plate superimposing several movement-related epochs. He did not find any
pre-movement potential, for the BP escaped him due to the short time constant
([tau]) necessary for the superposition method. Kornhuber and Deecke [34,35]
were lucky enough to select a [tau] of 1.2 s in order to enable discovery
of the BP. Certainly, for modern standards, this still is too short - attenuating
BP amplitude by more than 1/3 - and subsequently we used longer and longer
time constants ([tau] = 3, 5, 10, 20, etc.) until, from 1988, we have employed
only recordings with [tau] = [infinity], ie true DC-EEG (64-channel computer-assisted
DC-EEG amplifier [42].
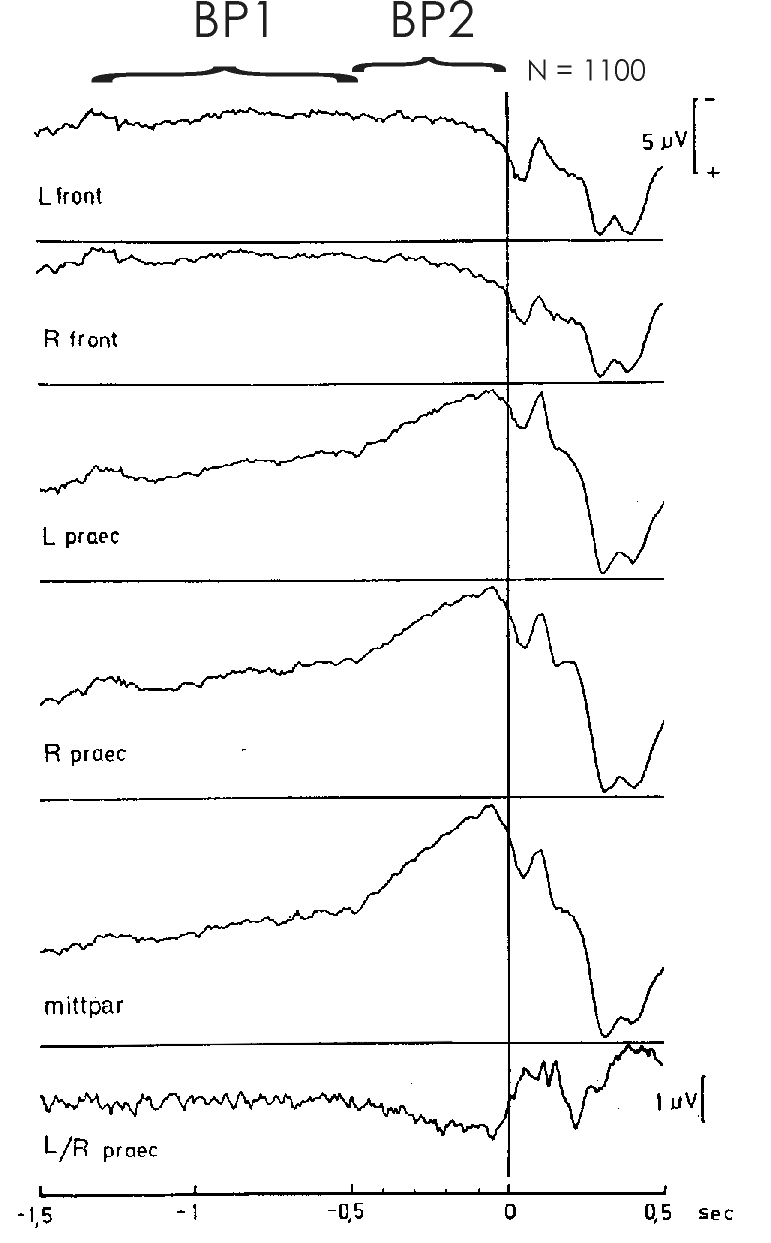
Fig. 1: Movement-related potentials in different recording locations
of a subject performing flexions of the right index finger (N=1100 self-initiated
movements). Bereitschaftspotential (BP) precentro-parietally negative;
frontally positive. BP1 (early component of the BP) app. 1½ to ½
s prior to movement onset. BP2 (late component of the BP) ½ s through
movement onset (s 0, vertical line). Pre-motion positivity (PMP, from culmination
point 90 to 80 ms prior to movement onset in all centro-parietal leads,
type C-subject). Motor potential (MP) in bipolar recording L/R precentral
60 to 50 ms prior to movement onset. Reafferent potentials (RAP) after
movement onset. From Deecke 1974 [13]
Figure 1 gives an example of the BP preceding voluntary right index
finger flexions. We see the slow negativity of the BP starting already
1½ s prior to the onset of movement (movement onset is at s 0, vertical
line). We also see the two components of the BP. As indicated at the top
of Fig. 1, we see an early, more shallow negative slope, BP1, and a late,
steeper negative slope, BP2. Barrett et al. [4] reported on three components
of the BP, introducing an 'intermediate component' between BP1 and BP2.
However, we never found an 'intermediate conponent' and believe that the
pre-voluntary movement period is best described postulating two principal
BP components corresponding to two principal generators. It is our hypothesis,
supported by many pieces of experimental evidence, that the BP1 principal
generator is the mesial prefrontal cortex including the supplementary motor
area (SMA) and probably also the cingulate motor area (CMA, see below),
while the BP2 principal generator is the primary motor cortex (MI, area
4, precentral gyrus, 'motor strip', etc.).
The BP as such has an early start of 1 to 2 s prior to movement onset,
for complex movements even as much as 3 s. For simple movements, as in
Fig. 1, the BP is positive in frontal leads, and negative in central and
parietal leads as well as at the vertex. According to theory of EEG, negativity
can be related to activity of the cortical areas under study, while positivity
is related to inactivity [11]. The BP voluntary movement paradigm investigates
internally-produced movements, ie those performed voluntarily [12,14,20,21].
For these volitional movements we postulate an 'act of will' necessary
to self-initiate the movement [36]. This certainly is a 'frontal act',
and the decision of 'when to move' is thought to be elaborated by the mesial
fronto-central cortex. This contains the SMA. However, there is evidence
that not only SMA but also adjacent parts of the cingulate gyrus are activated
prior to the onset of movement ('cingulate motor area', CMA) [47].
The situation is thus with unilateral voluntary movements. However,
what is the nature of bilateral movements? Experiments investigating unilateral
versus bilateral movements can tell us something about the temporal order
of the moments when activation starts in the two principal generators that
produce the BP, ie SMA as the principal generator for BP1 and MI as the
principal generator for BP2. When does activation start? There are three
possibilities: do both generators start activation at the same time, as
the Cleveland group believes [32], or is MI earlier than SMA, which nobody
believes or is SMA activation earlier than MI activation, which we believe
[20,22]. Our hypothesis that SMA is upstream in the final motor cascade
when it comes to channeling motivation, intention or the act of will into
motor execution is demonstrated in Fig. 2.
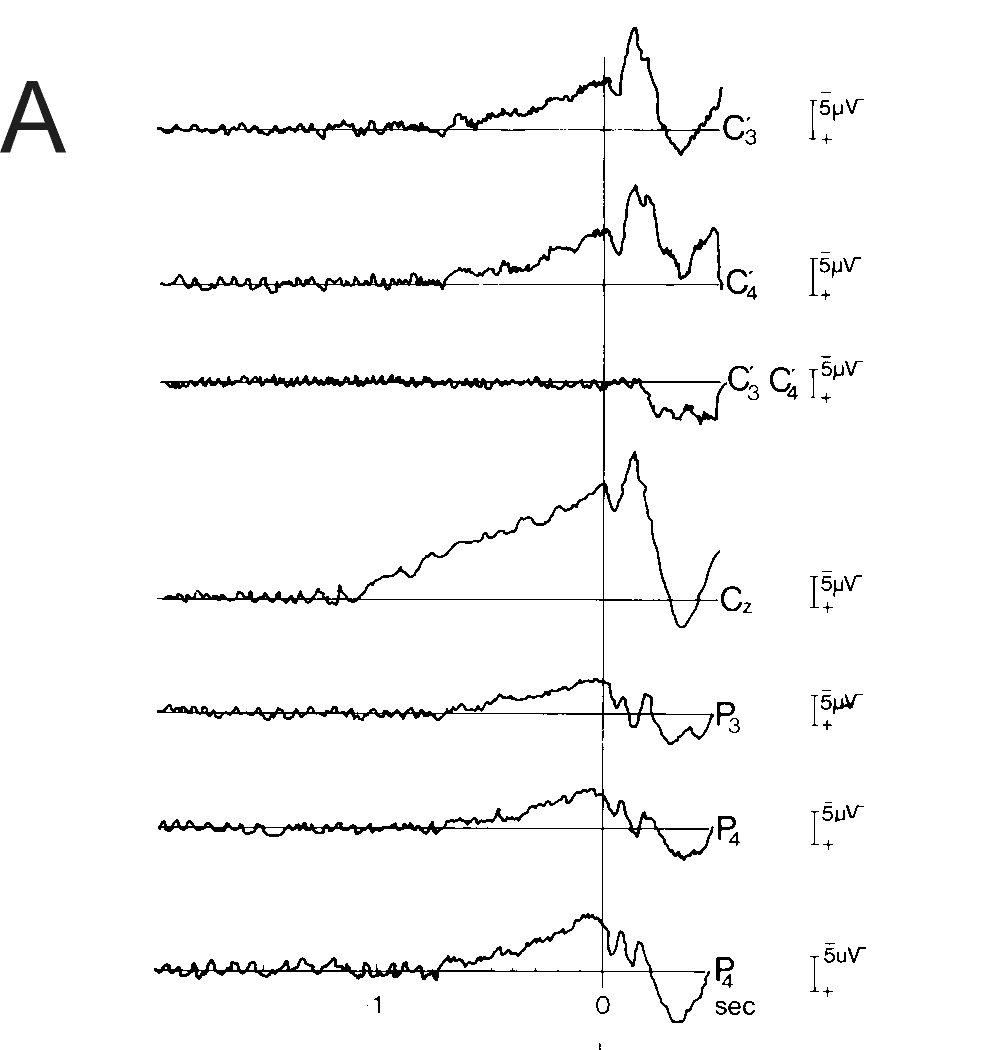
Fig. 2: Movement-related potentials preceding bilateral
voluntary movements.
A: Cerebral potentials preceding bilateral simultaneous simple
monophasic index finger flexions. Monophasic means as in all our experiments
in movement that the subject performed self-initiated brisk voluntary flexions
of the two index fingers that remained in flexed position returning to
indifferent position only during ITI (inter trial interval). Bereitschaftspotential
(BP) earliest and largest at vertex. Note that at the fronto-central midline
(vertex, Cz), negativity starts already at -1.1 s, while at the primary
motor cortex (MI, C'3, C'4), the BP starts significantly later, at -0.7
s (movement onset as usual at 0 s, vertical line).128 artifact-free trials.
Monopolar recordings against linked mastoids. C'3 or C'4 1cm anterior of
C3 or C4. Detail of Fig. 1 from Kristeva and Deecke, 1980 [37]
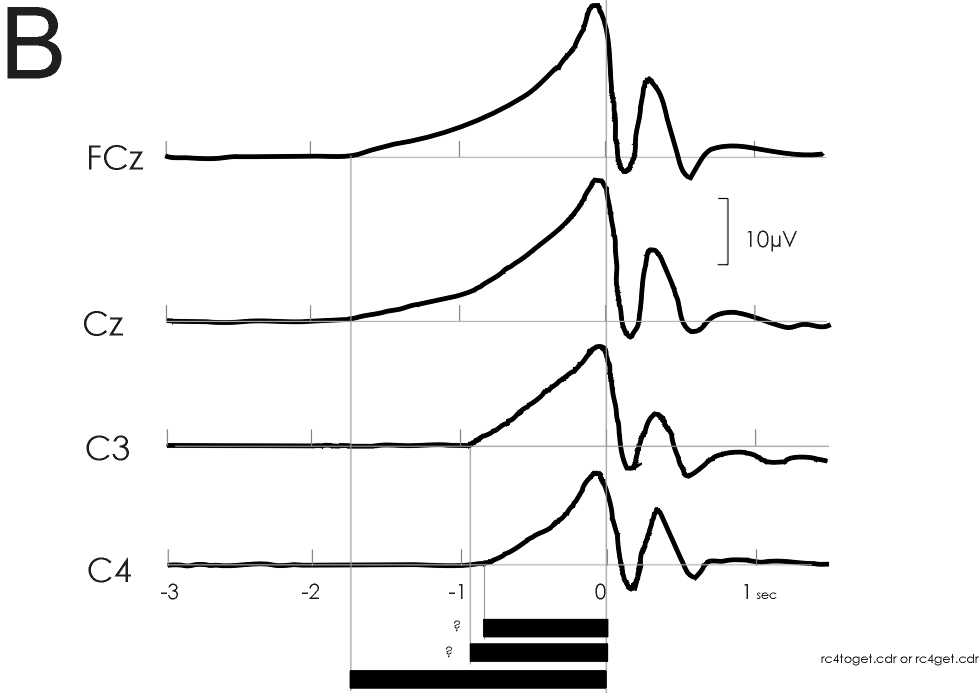
B: Cerebral potentials preceding bilateral simultaneous voluntary
self-initiated index finger extensions with different loads. Note similar
finding as in A: Early BP onset over the supplementary motor area (SMA,
fronto-central midline, FCz and Cz) at -1.8 s; significantly later BP onset
over primary motor cortex (MI, C3 and C4) at -0.8 s. The generally earlier
BP onset times are due to the fact that the loaded movements are complex
movements as opposed to the simple movements of A. From experiments of
Cui, Huter, Lindinger, Lang and Deecke (1997)
In Fig. 2A, the BP preceding simple monophasic bilateral index finger
flexions is shown. At the fronto-central midline (vertex, Cz), negativity
already starts at -1.1 s, while at the primary motor cortex (MI, C'3, C'4),
the BP starts significantly later, at -0.7 s (movement onset at 0 s, vertical
line). In Fig. 2B a nice confirmation of such thinking can be seen: experiments
in movement involving bilateral simultaneous voluntary self-initiated index
finger extensions with different loads were carried out by Cui et al. (in
preparation). We see an early BP onset over the supplementary motor area
(SMA, fronto-central midline, FCz and Cz) at -1.8 s, and a significantly
later BP onset over primary motor cortex (MI, C3 and C4) at -0.8 s. The
generally earlier BP onset times are due to the fact that the loaded movements
of Fig. 2B are complex movements as opposed to the simple movements of
Fig. 2A. We have shown that BP onset times ('latencies') increase with
the level of complexity of the movement, the longest onset times having
been observed with speaking [19] or writing and drawing [46].
MEG
Experiments in movement using the magneto-encephalogram (MEG) started
in 1982. Generally, all graphoelements of the EEG can also be found in
the MEG. Thus, the equivalent of the Bereitschaftspotential BP has been
recorded in the MEG and has been termed Bereitschaftsfeld (BF) or readiness
field (RF) [17]. The advantage of MEG over EEG is better localization.
The BF late component (BF2) has been localized in MI (area 4) [17,18].
It reveals the typical somatotopic organization described by Penfield and
Rasmussen [44], ie for movements of different parts of the body, the equivalent
current dipoles corresponding to BF2 were distributed in a homuncular pattern
[10], from which Fig. 3 is taken).
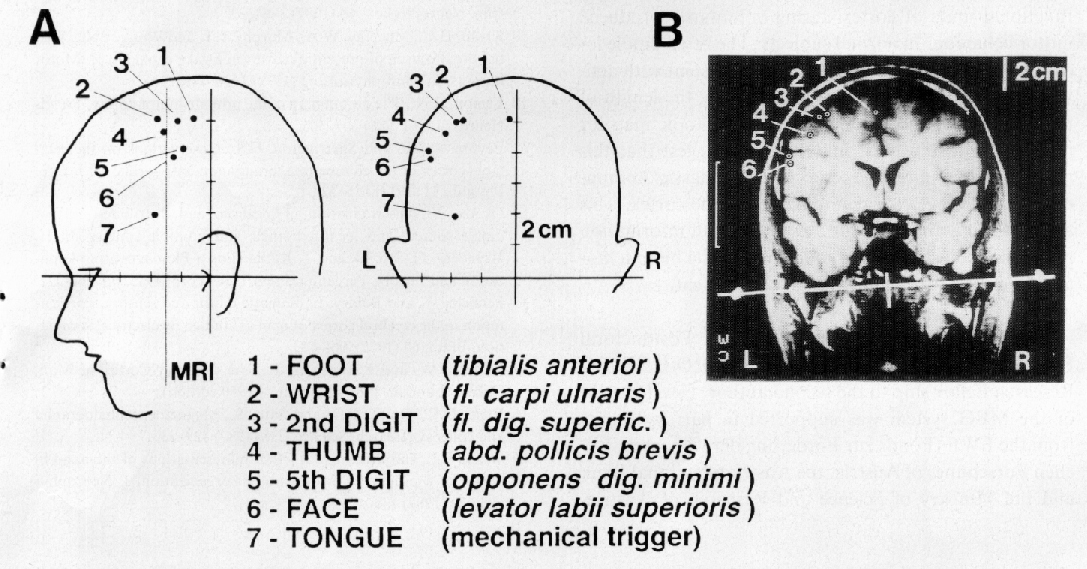
Fig. 3: Homuncular organization of the Bereitschaftsfeld´s
(BF) or readiness magnetic field´s (RF) late component (BF2/RF2).
A: Three-dimensional dipole source locations for 7 different
voluntary movement conditions projected onto lateral and posterior views
of the subject´s head. Head outlines are drawn from digitized points
taken over the sagittal and coronal midlines using the 3-D digitizing system
also used to produce the head coordinate system. Dipole locations are indicated
by filled circles and are numbered with respect to the voluntary movement
performed, and the muscle from which the EMG trigger was recorded as indicated
in the legend below (tibialis anterior, etc.).
B: Source locations projected onto a coronal magnetic resonance
image (MRI) taken from the same subject. A thin tube filled with contrast
agent (gadolinium) was placed over the anatomical landmarks used to establish
the head coordinate system (pre-auricular points and nasion) in order to
align the dipole coordinate system to that of the MR images. The MR plane
shown here lies parallel to the vertical-lateral plane of the head coordinate
system at the level indicated by the thin vertical line labelled `MRI'
anterior of the vertical line of the head coordinate system. Note homuncular
distribution of foot-, wrist-, digit-, face- and tongue movements indicating
that the generators of BF2/RF2 lie in primary motor cortex (area 4). From
Cheyne, Kristeva & Deecke, 1991 [10].
Figure 3A shows three-dimensional dipole source locations for seven
different movement conditions as indicated. Sources of neural activity
- identified using the non-invasive measurements of cerebral magnetic fields
(MEG) - were found to confirm the somatotopic organization of primary motor
cortex for movements of different parts of the body in normal human subjects.
The somatotopic map produced with this technique revealed slight differences
to the classic homunculus obtained from studies using invasive cortical
stimulation in epileptic patients [44]. In Fig. 3B these source locations
were projected onto a coronal magnetic resonance image (MRI) taken from
the same subject. The typical homuncular distribution of foot-, wrist-,
digit-, face- and tongue movements indicated that the generators of BF2/RF2
lie in area 4. An exception is the dipole for voluntary tongue movements.
It showed more variability due to mechanical triggering and other causes.
So far so good for the MI generator (BF2). MEG localization of the BF1
generator was less readily achieved. In the healthy subject, both SMA generators
are also active in case of unilateral movement. Due to the anatomical localization
of the SMA on the mesial surface of the two hemispheres, the two SMAs face
and partially cancel eachother. Therefore, we made experiments in movement
in a patient with a right SMA lesion [40]. Unilateral SMA lesion was selected
in order to overcome the cancellation problem in MEG of the two opposing
SMA dipoles in the normal subject. The patient having only one (the left)
SMA, performed voluntary flexions with his right index finger. The results
were quite convincing: in the early phase of the readiness magnetic field
(1.2 to 0.8 s prior to the onset of movement, corresponding to BP1) field
lines left the head at the vertex (Cz) and entered the head at a frontal
position between F3 and Fz, thus enveloping an electric dipole on the mesial
surface of the left hemisphere in the left (intact) SMA. A similar dipole
was found during the period 0.8 to 0.6 s prior to the onset of movement,
still corresponding to the BP1-SMA system. However, in the late phase of
the readiness field (during BP2), in this case measured between 0.2 and
0 s prior to movement onset, activity had shifted: magnetic field lines
now left the head at FC3 and entered it at FCz. This indicated
an electrical dipole in the left area-4 hand representation (MI). This
again supports our hypothesis that the SMA leads the MI motor cortex activation
prior to human voluntary movement. We believe that any self-initiated movement
is preceded by SMA activity [14] and largely based on our BP results[25].
Thus, we can state: Activation of SMA/CMA leads activation of MI in
time. For this and other reasons we attribute the starting function
of voluntary action to the SMA. Patients with chronic unilateral lesions
of one SMA were examined using a voluntary movement paradigm involving
different kinds of bimanual motor sequences [3]. Clinically, these patients
presented with bradykinesia contralateral to the lesion, deceleration of
initial movement, switching from sequential performance into simultaneity
and frequent failure to initiate or inhibit a movement on one or other
side. The clinical syndrome of SMA lesion is termed motor dysrhythmia
or dyschronokinesia. BP (prior to movement) and negativity of
performance (N-P, post movement onset) were larger over the lesioned hemisphere.
This seemingly paradoxical result is due to the orientation of the dipole
of the remaining SMA on the mesial surface of the hemisphere.
The bradykinesia of these frontal patients resembled that seen in basal
ganglia disorder (Parkin-son's disease, PD). In the latter, the BPs are
normal over the SMA but reduced and delayed over MI. On closer examination,
in PD BP1 is reduced, while a normal BP2 helps the patient to pull up,
at movement onset reaching almost the same amplitude as in normal controls
- even overshooting after movement onset. The BP changes in PD as compared
to healthy controls reveal that postsynaptic changes occur as well as presynaptic
changes (dopamine depletion) in PD, ie dysfunction of cortical structures
as a `hodological' consequence of the dopaminergic deficiency! That is
why PD patients have trouble in self-initiation (action) while responding
to external stimuli (re-action) is less impaired [15,16,24,31,48,49]. These
postsynaptic dysfunctions seem to be partially reversible with L-Dopa substitution
[24,27].
Analyses of BP topography revealed that the contribution of the SMA
to the BP was reduced in PD [24]. PET studies confirmed a diminution of
movement-related SMA activation [33,45]. In primate models of PD, it now
became clear that the feedback circuits between cortex, basal ganglia,
and thalamus are disturbed in this disease [1,2,23]; ie there is a lack
of inhibition of the inhibitory action of the globus pallidum internum
(Gpi) on the excitatory (glutamatergic) thalamo-cortical pathways. This
dopaminergic lack of inhibition of inhibition is the intrinsic pathophysiology
of the disease: Parkinson patients are akinetic because they are caught
in the state of this enormous Gpi-`hyperinhibition', which in the untreated
severe cases downregulates their motor capacity to a complete `rien
ne va plus.'
Internal pallidotomy can markedly improve akinesia [23,38]. Why is it
effective? Now we can understand, why: It removes this `all paralyzing'
hyperinhibition from the thalamocortical output circuits. The SMA is one
of the major projection areas of these thalamo-cortical circuits receiving
even stronger input than MI. It has been shown that post pallidotomy, movement-related
SMA activity as assessed by PET is restored in PD patients [9,28]. It is
likely that the Parkinson-typical changes of the Bereitschaftspotential
will also normalize post pallidotomy, though this has not been shown so
far. However, it is clear that Parkinson akinesia is the result of dysfunction
of a complicated feedback circuit system, in which not only the basal ganglia
but also the SMA plays an important role.
Emission CT (SPECT)
Experiments in movement have also been carried out using emission CT.
Of the two methods of this family (PET and SPECT), SPECT has been employed.
Using the compound HMPAO that shows a trapping effect in brain tissue,
rCBF as the one physiological parameter and movement-related DC-potentials
as the other were measured in the same 17 normal Ss. A visuomotor tracking
(T) paradigm was employed [39]. Trajectorial learning was required in a
conflicting situation: a visual target moved on a screen and had to be
track-ed by moving a light stylus in the right hand on a photo-detector
plate in an inverted fashion (IT), eg movements of the target to the right
side required hand movement to the left and vice versa. Compared to a normal
non-inverted control task (T). IT required the development of a novel motor
program and the prevention of returning to routine direct persuit.
These additional demands in IT caused a relative hyperperfusion in regions
including the middle frontal gyri, frontomedial cortex (containing the
SMA), right basal ganglia, and left cerebellum. Correlations of rCBF values
between the middle frontal gyrus and basal ganglia indicated a functional
relation between these two brain structures. Trajectorial performance was
accompanied by slow negative DC-potential shifts before tracking
(BP) and during tracking (negativity of performance, N-P). In frontolateral
and frontomedial (containing the SMA) recordings, amplitudes of DC-negativity
were higher in IT than they were in T. This additional frontal negativity
covaried with the success in trajectorial learning. These results substantiated,
using a dual approach, our previous suggestion that the frontal lobe plays
an important role in trajectorial learning in providing a learning memory
for novel motor skills. Cognitive skills relevant for performing music
were investigated as well, also emphasizing a role of the SMA in timing.
Other studies dealt with the investigation of motor imagery, that is
we are able to see something `in our mind´s eye.' For example athletes
make use of motor imagery (`mental rehearsal') before the trial in order
to improve performance. Their `mental representation of motor acts' is
so good that they know beforehand whether a stroke for instance in golf
will be a hit or a miss. We conducted a topographical study on the mental
imagery of motor and other tasks [30,50].
The imagery paradigm. An experiment was carried out in
which human mental activity was recorded and mapped through scalp electrodes
using 12-channel DC-amplifiers (Fig. 4) [50].
The problem: Mental activity usually occurs spontaneously and
unpredictably. The recording of cortical DC-potentials requires averaging.
How can the averaging process be triggered by an unpredictable event?
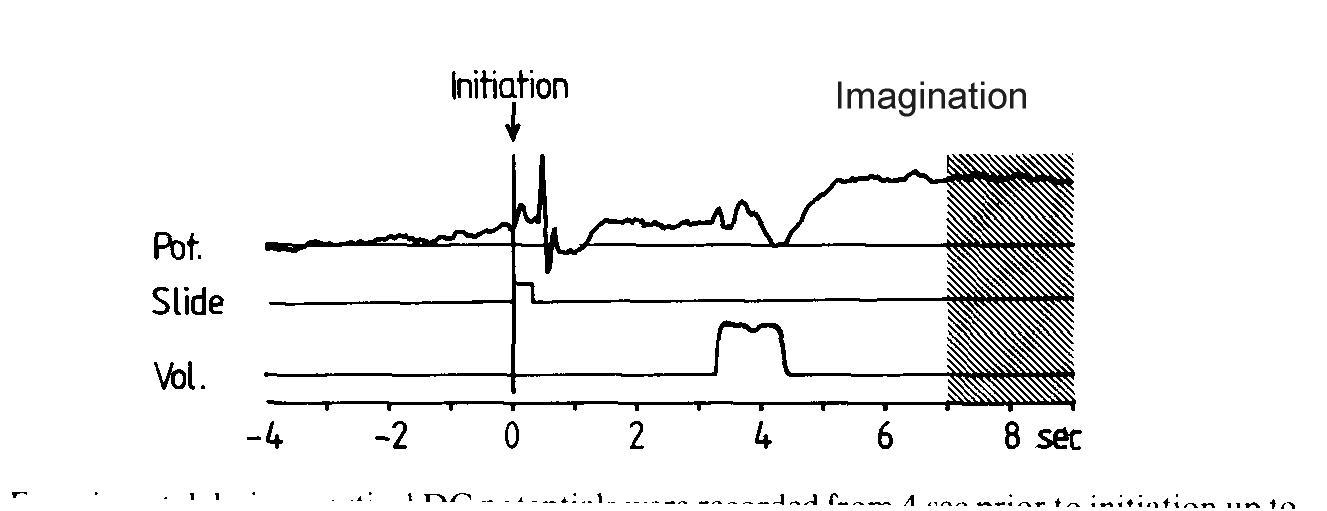
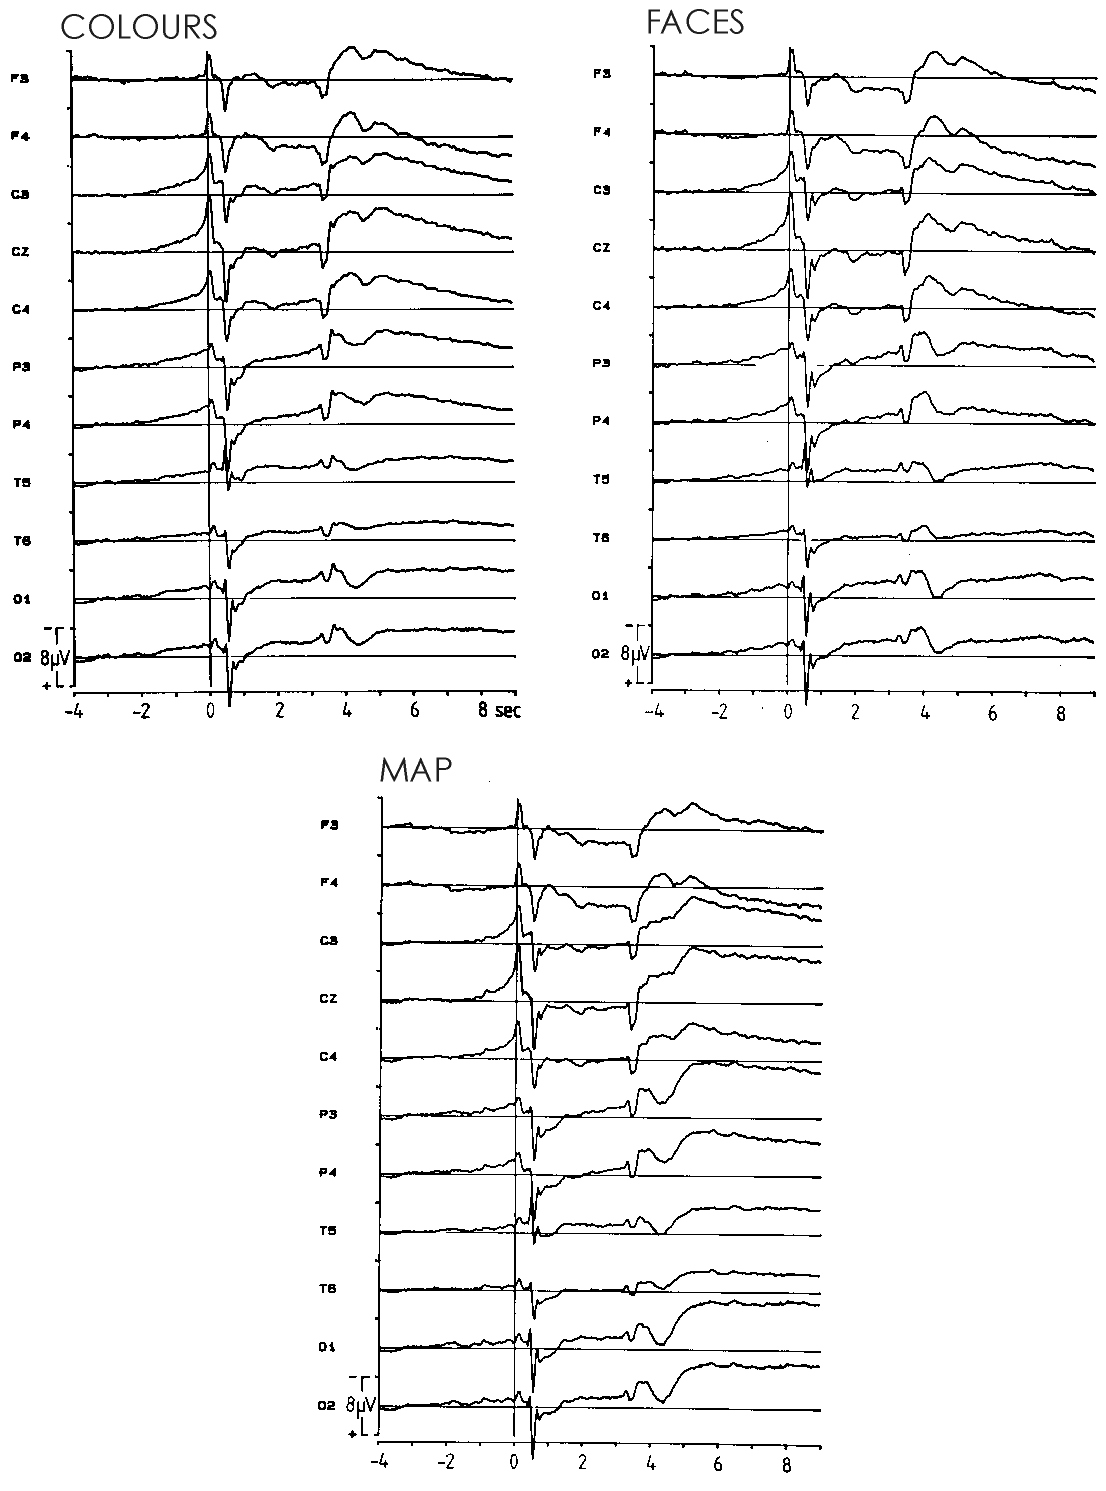
Fig. 4: Experiments in movement imagery.
A: Imagery paradigm. Negative DC-shifts (upper trace) were recorded
from 4 s before to 9 s after the volitional initiation of the trial (subjects
presented themselves with a slide by self-initiated button presses with
both index fingers simultanously). Centre trace, time marker indicating
presentation of slide revealing the condition (COLOUR, FACE or MAP). The
lower trace depicts the moment of the auditory item presentation (particular
politician, or particular colour or route from 1 to 2 on the spatial map).
The hatched area marks the time range from s 7 to 9 of epoch for calculating
the mean amplitude of DC-negativity during mental imagery.
B: DC potential waveforms averaged across all 28 subjects for
imagining COLOURS (left), FACES (right) and the spatial MAP (bottom). Negativity
up. The vertical line represents the moment when subjects initiated the
stimulus programme by pressing buttons with both index fingers simultaneously.
Note that COLOURS created higher amplitudes (generators on the convexity)
than did FACES (generators at the brain base, infratemporal and infraoccipital
locations). Highest amplitudes with MAP due to occipito-parietal generators
(separate visual pathways for object vision and spatial vision according
to Mishkin et al. [43]). Modified from Uhl et al. 1990.
The solution: The S starts the trial by a self-initiated voluntary
movement (preceded by a BP), ie the S presses buttons of a slide projector
presenting himself with a slide. This initiating movement provides the
trigger for time-locked potential averaging (at s 0 in Fig. 4). Instantaneously,
a slide appears on the screen in front of the S for 200 ms (ending at s
0.2 ). By the contents of the slide, the S was instructed which of the
3 categories - colours, faces or a spatial map - would follow. After 3
s, a recorded voice announced the item that was to be imagined by mental
imagery for a duration of 0.2 s (from s 3.2 to 4.4 in Fig. 4). Ss were
instructed to create a visual image of the item, ie to see it in their
mind's eye. They were asked to generate this image as soon as possible
after they had heard the word and to hold it until the experimenter announced
the end of the trial. This was done at irregular intervals in order to
prevent the occurence of an expectancy wave (CNV) [51].
When taking the measurement of the cortical DC-level between s 7 and
9, one has a high probability that the cooperative S actually performs
the mental task of imagery, which can then be recorded and mapped over
the scalp. The results showed that the bilateral movement of pressing buttons,
occuring at s 0, was preceded by a BP. This showed the usual central maximum
and was bilaterally symmetrical. It was frontally absent, since no learning
was involved in this paradigm. However, it was also present in occipital
leads, where the BP is usually absent preceding simple finger movement
tasks.
Thus, already in the distribution of the BP preceding it, the present
visual task displayed itself in a modality-specific manner. After the onset
of movement, a visual evoked potential in response to the self-presentation
of the slide occured. Thereafter, we see a typical expectancy wave (CNV)
in anticipation of the loudspeaker stimulus announcing the item to be imagined,
followed by the auditory (verbal) evoked potential in response to the item
presentation. While the early potential complex seemed to be rather normal,
the late components appeared to be quite remarkable: the peak that appeared
at s 4.4 (1.2 s after the onset of the loudspeaker signal) showed reversal;
it was negative over frontal areas (F3 to C4) and positive over posterior
areas (P3) at s 4.4. Thus, it pointed towards a generator process in deeper
structures that is perhaps related to word comprehension and memory storage.
DC-shifts during imagery: Since Ss were instructed to start immediately
imagining the item announced and maintain the image, the subsequent DC-potential
shifts are undoubtedly related to creating and maintaining mental imagery.
While over frontal and central areas, negative shifts declined, there was
sustained DC-negativity over the retrorolandic brain, that is only at areas
showing sustained negativity we assumed imagery to actually occur. Since
frontal and central areas showed large initial DC-negativity it seems reasonable
to assume that these areas, in particular frontal ones, participate in
the generation of imagery. The maintainance of the imagery finally seems
to occur in retrorolandic brain regions only, measurements being taken
between s 7 and 9 (hatched area in Fig. 4). And here we found inter-esting
topographical differences between the 3 categories of imagined items. The
level of negativity was lowest for faces, medium for colours and highest
for the map (Fig. 4). It is surprising that imagination of images that
complex as faces generated less negativity than did imagining of colours
(plain unicoloured sheets).
The explanation might be that face imagery is more inferotemporal than
is that of colours and - in particular - the map, which is more parietal.
Negative DC-shifts in basal cortical areas were not seen by our electrodes
arranged over the convexity of the skull, and, what is more, these areas
can even inject a positive bias on the DC-shift recorded via the linked
ears reference electrodes. The fact that the map caused maximum overall
DC-negativity also fits this assumption because now imagery particularly
involved areas of the convexity, namely the parietal lobes. The cortical
DC-potential (prevailing between s 7 and s 9 of the epoch - imagery period)
was mapped using current source density mapping algorithms (Laplacian transformation
and spline interpolation) [42]. With this display, the 2 experimental conditions
involving visual imagery (faces and colours) differed from the condition
spatial imagery (map). The faces´ and colours´ regional
DC-negativities were distributed over the occipital cortex and over temporal
areas, showing a preponderance over the left hemisphere. For the spatial
map the topography was different, regional DC-negativity being distributed
occipitally (but somewhat more anteriorly) and parietally (not temporally).
A slight left preponderance was observed here also.
We conclude from these observations that visual imagery and spatial
imagery differ in their regional DC-negativity pattern, the first having
an occipital and temporal distribution the latter having an occipital and
parietal topography. Since the same difference was found for visual and
spatial perception, we considered our data as subserving further evidence
for the postulate that imagery takes place at the same areas that elaborate
the percepts.
HMPAO-SPECT and mental imagery
30 Ss - 28 of whom were identical with those of the DC-potential study
- participated in the experiments [30]. The distribution of rCBF was assessed
during a resting state and during imagining either colours or faces - visual
imagery - or a route on a map -spatial imagery- similar as in the DC-potential
experiment [50]. Ss were in a supine position, and were blindfolded. An
intravenous line was laid to a cubital vein before the experiment. Ss wore
earphones connected to a tape recorder, which announced the items to be
imagined at a rate of 15 s. Imagery experiments were compared to resting
state sessions during which the tape was silent and Ss were advised to
lie relaxed and 'to think of nothing'.
The results showed that - as compared to the resting state - the imagination
of faces caused distinctly more regional activation than with the other
two imagery conditions. Statistically, imagining faces was also the only
condition that led to an increase of activity in - particularly the left
- inferior occipital region which has been suggested by previous studies
as being a crucial area for visual imagery [5,26,29,30,50]. Also for colours,
basal temporal and occipital regions are activated but less so than for
faces.
The imagery of routes on a map, on the contrary, showed a tendency towards
more activation in visual association areas on the convexity of the brain,
particularly in parietal areas. This is another piece of evidence for a
'visual/spatial dichotomy' as suggested by Mishkin et al. [43]. We now
know that the visual modality has many submodalities such as form, disparity,
colour, motion perception and others that are envisaged of being represented
in different visual subsystems, some of which occupying distinct areas
of the visual association cortex V1 to V7. Mishkin's distinction between
object vision and spatial vision being represented in two
separate visual pathways is a particularly intriguing concept which is
partially corroborated by the two imagery studies reported here.
Furthermore, the finding in our SPECT study [30] that imagining faces
involves basal cortical areas to a greater extent than does colour and
map imagery - the latter rather activating the parietal convexity - can
explain the above paradoxical result of our DC-potential study [50] that
the imagination of faces yielded less overall negativity than did colours.
Since the information content of faces is by orders of magnitude higher
than the one of plain unicoloured sheets, this paradox can be explained
by the greater degree of 'basality' (inferotemporal, inferooccipital) of
faces as compared to colours. It is important to consider that there are
large cortical regions which the electroencephalographer does not see.
This again calls for the joint studies. From the SPECT study on imagery
[30] we can conclude as well that imagery occurs in those brain
areas where perception takes place.
FMRI
The technique of functional magnetic resonance imaging allows the measurement
of activation-related cerebral blood flow changes occuring with specific
tasks. However, the spatial relationship between neuronal activity and
functional cerebral blood flow changes is not known yet. A study was carried
out in order to compare the centre of neuronal activation (measured by
MEG) with that of the blood flow responses (measured by FMRI). Eight Ss
participated in a typical BP paradigm (ie voluntary movement paradigm)
of tapping with their right index finger [7,8]. The results are shown in
Fig. 5.
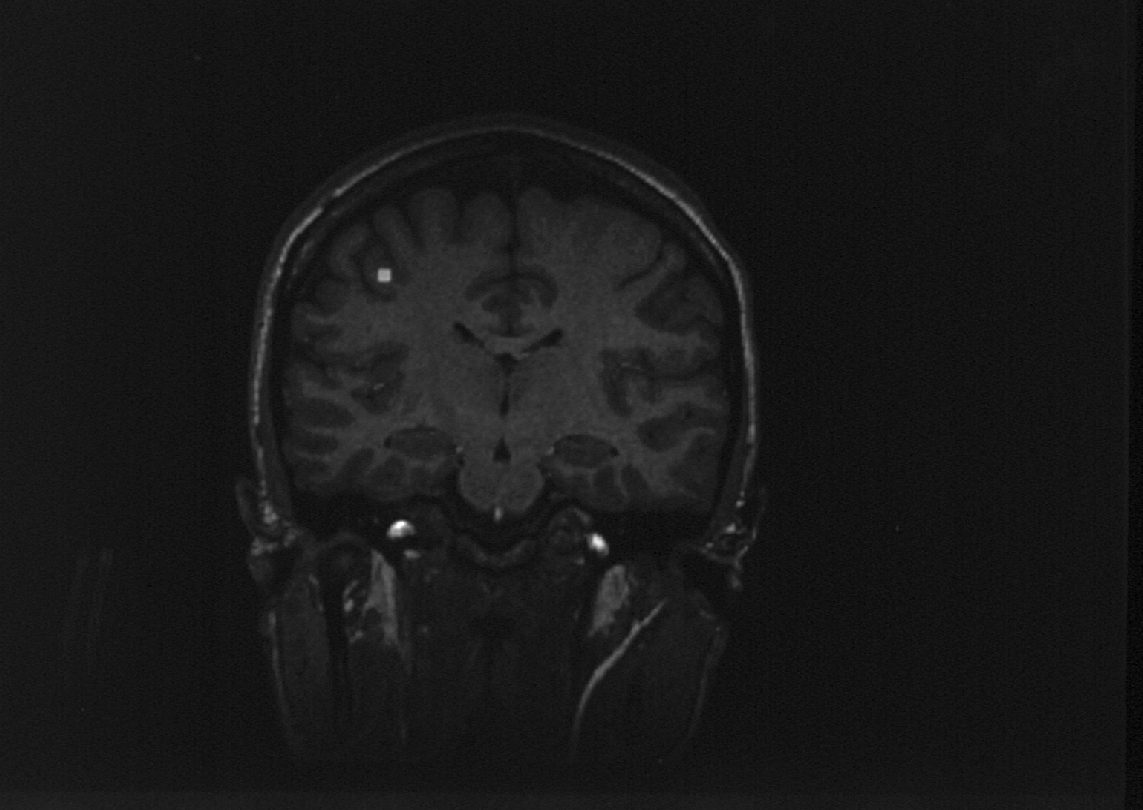
Fig. 5: Experiments in movement using FMRI and MEG.
Coronal section of MRI of a subject. Right is left. The common centre
of neuronal activation (which is the mean of the motor and sensory cortex
MEG centres) is shown by the triangle. The centre of the blood flow response
is shown by the square. Note that `neuronal signal' and `cerebrovascular
signal' are not identical. From: Beisteiner et al. [7]
Experiments in movement are shown using FMRI and MEG. Fig. 5 shows a
coronal section of an MRI of a subject. The common centre of neuronal activation
(which is the mean of the motor and sensory cortex MEG centres) is shown
by the triangle. The centre of the blood flow response is shown by the
square. As can be seen, the `neuronal signal' (MEG) and the `cerebrovascular
signal' (FMRI) are not at the same location. Rather a difference in topography
between the two signals is seen. On the average, the two signals were about
1½ cm separate from eachother, which calls for methodological improvements,
ie both signals lay in the left MI area but 1½ cm apart from each
other. One source of localization error may be pixels with large signal
amplitudes, since these pixels may be expected to stem from larger vessels
that may be even remote from the centre of neuronal activation (large vessel
effect). Using MEG - thought to be very close to the `neuronal signal'
- in addition to the `cerebrovascular signal' (FMRI) in a simple finger
tapping task, such multimethodological approach should help to improve
FMRI brain mapping results. It was in favour of this hypothesis that results
showed, indeed, a deterioration of FMRI localization quality with increasing
signal amplitudes indicating increased contribution of the large vessel
effect. Thus, for FMRI evaluation it is recommended pixels with large signal
amplitudes be excluded in order to reduce the large vessel effect, and
to get closer to the neuronal signal, which is the important parameter
in functional topography of the brain.
REFERENCES
-
Alexander GE, DeLong MR, Strick PL. Parallel organization of functionally
aggregated circuits linking basal ganglia and cortex. Ann Rev Neurosci
1986 9, 357-81.
-
Alexander G. Basal ganglia - thalamocortical cortical circuits: Their role
in control of movements. J Clin Neurophysiol 1994 11, 420-31
-
Asenbaum S, Oldenkott B, Lang W, Lindinger G, Deecke L. Motor sequences
in patients with unilateral SMA lesions: Movement-related potentials and
motor disorders. In: Brunia CHM, Gaillard AWK, Kok A (eds): Psychophysiological
Brain Research. Vol. I, Tilburg University Press 1990, pp 119-23.
-
Barrett G, Shibasaki H, Neshige R. Cortical potentials preceding voluntary
movement: evidence for three periods of preparation in man. Electroenceph
Clin Neurophysiol 1986: 63(4), 327-39.
-
Basso A, Bisiach E, Luzatti C. Loss of mental imagery: a case study. Neuropsychologia
1980: 18, 435-42.
-
Bates JAV. Electrical activity of the cortex accompanying movements. J
Physiol (Lond) 1951: 113, 240.
-
Beisteiner R, Gomiscek G, Erdler M, Teichtmeister C, Moser E, Deecke L.
Funktionelles Magnet Resonanz Imaging (FMRI) - Ergebnisse und Kombinationsmöglichkeiten
mit der Magneto- und Elektroenzephalographie. In: W Lang, L Deecke, HC
Hopf (eds): Topographische Diagnostik des Gehirns. Springer Wien Vh Dt
Ges Neurol 1995a: 9, 189-92.
-
Beisteiner R, Gomiscek G, Erdler M, Teichtmeister C, Moser E, Deecke L.
Comparing localization of conventional functional magnetic resonance imaging
and Magnetoencephalography. Eur J Neurosci 1995b: 7, 1221-4.
-
Ceballos-Baumann AO, Obeso JA, Vitek JL, DeLong MR, Bakay R, Linazasoro
G, Brooks DJ. Restoration of thalamocortical activity after postero-ventral
pallidotomy in Parkinson´s disease. Lancet 1994: 344, 814.
-
Cheyne D, Kristeva R, Deecke L. Homuncular organization of human motor
cortex as indicated by neuromagnetic recordings. Neurosci Lett 1991: 122,
17-20.
-
Creutzfeldt OD. Cortex cerebri. Springer Berlin, Heidelberg New York, Tokyo
1983:pp 145-9.
-
Deecke L, Scheid P, Kornhuber HH. Distribution of readiness potential,
pre-motion positivity, and motor potential of the human cerebral cortex
preceding voluntary finger movements. Exp Brain Res 1969: 7, 158-68.
-
Deecke L. Die corticalen Potentiale des Menschen vor raschen willkürlichen
Fingerbewegungen. Habilitationsschrift. University of Ulm Library (1974)
-
Deecke L, Grözinger B, Kornhuber HH. Voluntary finger movement in
man: cerebral potentials and theory. Biol Cybern 1976: 23, 99-119.
-
Deecke L, Englitz H-G, Kornhuber HH, Schmitt G. Cerebral potentials preceding
voluntary movement in patients with bilateral or unilateral Parkinson akinesia.
In: Desmedt JE. (ed): Attention, voluntary contraction, and event-related
cerebral potentials. Prog Clin Neurophysiol 1977: Vol 1, pp 151-63.
-
Deecke L, Kornhuber HH. An electrical sign of participation of the mesial
`supplementary' motor cortex in human voluntary finger movement. Brain
Res 1978: 159, 473-76.
-
Deecke L, Weinberg H, Brickett P. Magnetic fields of the human brain accompanying
voluntary movement. Bereitschaftsmagnetfeld. Exp Brain Res 1982: 48, 144-48.
-
Deecke L, Boschert J, Weinberg W, Brickett P. Magnetic fields of the human
brain (Bereitschaftsfeld) preceding voluntary foot and toe movements. Exp
Brain Res 1983: 52, 81-86.
-
Deecke L, Engel M, Lang W, Kornhuber HH. Bereitschaftspotential preceding
speech after holding breath. Exp Brain Res 1986: 65, 219-23.
-
Deecke L, Bereitschaftspotential as an indicator of movement preparation
in supplementary motor are and motor cortex. In: R. Porter (Chair), Motor
Areas of the Cerebral Cortex. Wiley. Chichester, Ciba Found Symp 1987:
132, pp 231-50.
-
Deecke L. Electrophysiological correlates of movement initiation. Rev Neurol
1990: 146/10, 612-19.
-
Deecke L, Lang W. Generation of movement-related potentials and fields
in the supplementary sensorimotor area and the primary motor area. In:
Lüders HO (ed.) Supplementary Sensorimotor Area - Advances in Neurology
1996: Vol 70 Lippincott/Raven Publishers pp 127-46.
-
DeLong MR. Primate models of movement disorders of basal ganglia origin.
Trends Neurosci 1990: 13, 281-85.
-
Dick JPR, Rothwell JC, Day BL, Cantello R, Buruma O, Gioux M, Benecke R,
Berardelli A, Thompson PD, Marsden CD. The Bereitschaftspotential is abnormal
in Parkinson´s disease. Brain 1989: 112, 233-44.
-
Eccles JC. The initiation of voluntary movements by the supplementary motor
area. Arch Psychiat Nervenkr 1982: 231, 423-41.
-
Farah MJ. The neurological basis of mental imagery: a componential analysis.
Cognition 1984: 18, 245-72.
-
Feve AP, Bathien N, Rondot P. Chronic administration of L-Dopa affects
the movement-related cortical potentials of patients with Parkinson´s
disease. Clin Neuropharmacol 1992: 15, 100-8.
-
Grafton ST, Waters C, Sutton J, Lew MF, Coudwell W. Pallidotomy increases
activity of motor association cortex in Parkinson´s disease: A positron
emission tomographic study. Ann Neurol 1995: 37, 776-83.
-
Goldenberg G. Neurologische Grundlagen bildlicher Vorstellungen, Springer
Wien, New York (1987)
-
Goldenberg G, Podreka I, Uhl F, Steiner M, Willmes K, Deecke L. Cerebral
correlates of imagining colours, faces and a map - I. SPECT of regional
cerebral blood flow. Neuropsychologia 1989: 27, 1315-28.
-
Harasko-van der Meer C, Gerschlager W, Lalouschek W, Lindinger G, Deecke
L, Lang W. Breitschaftspotential preceding onset and termination of a movement
is abnormal in Parkinson´s disease. Movement Disorders 1996: 11 Suppl
1, 84.
-
Ikeda A, Lüders HO, Burgess RC, Shibasaki H. Movement-related potentials
associated with single and repetitive movements recorded from human supplementary
motor area. Electroenceph Clin Neurophysiol 1993: 89, 269-77.
-
Jenkins IH, Fernandez W, Playford ED, Lees AJ, Frackowiak REJ, Passingham
RE, Brooks DJ. Impaired activation of the supplementary motor area in Parkinson´s
disease is reversed when akinesia is treated with apomorphine. Ann Neurol
1992: 32, 749-67.
-
Kornhuber HH, Deecke L. Hirnpotentialänderungen beim Menschen vor
und nach Willkürbewegungen, dargestellt mit Magnetbandspeicherung
und Rückwärtsanalyse. Pflügers Arch 1954: 281, 52.
-
Kornhuber HH, Deecke L. Hirnpotentialänderungen bei Willkürbewegungen
und passiven Bewegungen des Menschen: Bereitschaftspotential und reafferente
Potentiale. Pflügers Arch 1965: 284, 1-17 `Citation Classic'
-
Kornhuber HH, Deecke L, Lang W, Lang M, Kornhuber A. Will, volitional action,
attention and cerebral potentials in man: Bereitschaftspotential, performance-related
potentials, directed attention potential, EEG spectrum changes. Chapter
6 in: WA Hershberger (ed) Volitional action, Elsevier (North Holland),
Amsterdam 1989: 107-68.
-
Kristeva R, Deecke L. Cerebral potentials preceding right and left unilateral
and bilateral finger movements in sinistrals. In: HH Kornhuber, L Deecke
(eds): Motivation, motor and sensory processes of the brain: Electrical
potentials, behaviour and clinical use. Progr Brain Res 1980: Vol 54 Elsevier
Amsterdam 748-54.
-
Laitinen LV, Bergenheim AT, Hariz MI. Leksell´s posteroventral pallidotomy
in the treatment of Parkinson´s disease. J Neurosurg 1992: 76, 53-61.
-
Lang W, Lang M, Podreka I, Steiner M, Uhl F, Suess E, Müller C, Deecke
L. DC-potential shifts and regional cerebral blood flow reveal frontal
cortex involvement in human visuomotor learning. Exp Brain Res 1988: 71,
353-64.
-
Lang W, Cheyne D, Kristeva R, Beisteiner R, Lindinger G, Deecke L. Three-dimensional
localization of SMA activity preceding voluntary movement. A study of electric
and magnetic fields in a patient with infarction of the right supplementary
motor area. Exp Brain Res 1991: 87, 688-95.
-
Lindinger G, Svasek P, Lang W, Deecke L. PC-supported 64-channel DC-EEG
amplifier. In: Adlassnig KP, Grabner G, Bengtsson S, Hansen R (eds) Lecture
notes in medical informatics 45. Springer Berlin 1991: 1005-9.
-
Lindinger G, Baumgartner C, Burgess R, Lüders H, Deecke L. Topographic
analysis of epileptic spikes using spherical splines and spline laplacian
(CSD). J Neurol 1994: 241, 276-7.
-
Mishkin M, Ungerleider LG, Macko KA. Object vision and spatial vision:
the two cortical pathways. Trends Neurosci 1983: 6, 414-17.
-
Penfield W, Rasmussen AI. Cerebral cortex of man. A clinical study of localization
of function. Mac Millan, New York (1950)
-
Rascol O, Sabatini U, Chollet F, Celis P, Montastruc JC, Marc-Vergnes JP,
Rascol A. Supplementary and primary sensory motor area activity in Parkinson´s
disease. Regional cerebral blood flow changes during finger movements and
effects of apomorphine. Arch Neurol 1992: 49, 144-8.
-
Schreiber H, Lang M, Lang W, Kornhuber A, Heise B, Keidel M, Deecke L,
Kornhuber HH. Frontal hemispheric differences of the Bereitschaftspotential
associated with writing and drawing. Hum Neurobiol 1983: 2, 197-202.
-
Shima K, Aya K, Mushiake H, Inase M, Aizawa H, Tanji J. Two movement-related
foci in the primate cingulate cortex observed in signal-triggered and self-paced
forelimb movements. J Neurophysiol 1991: 65, 188-202.
-
Simpson JA, Khuraibet AJ. Readiness potential of cortical area 6 in Parkinson´s
disease. Evidence for a dopaminergic striatal control of postural set involving
supplementary motor area. J Neurol Neurosurg Psychiat 1986: 49, 475.
-
Simpson JA, Khuraibet AJ. Readiness potential of cortical area 6 preceding
self paced movement in Parkinson´s disease. J Neurol Neurosurg Psychiat
1987: 50, 1184-91.
-
Uhl F, Goldenberg G, Lang W, Lindinger G, Steiner M, Deecke L. Cerebral
correlates of imagining colours, faces and a map - II. Negative cortical
DC-potentials. Neuropsychologia 1990: 28, 81-93.
-
Walter WG, Cooper R, Aldridge VJ, McCallum WC, Winter AI. Contingent negative
variation: An electric sign of sensori-motor association and expectancy
in the human brain. Nature 1964: 203, 380.