![]() Top
Top
![]() Abstract
Abstract
![]() Introduction
Introduction
![]() Methods and Materials
Methods and Materials
![]() Results
Results
![]() Discussion
Discussion
![]() References/Acknowldgements
References/Acknowldgements
|
|
|---|
Sacit Karamürsel(1)
and Theodore H. Bullock(2)
Neurobiology Unit, Scripps Institution of Oceanography and
School of Medicine, Department of Neurosciences,
University of California, San Diego
La Jolla, California 92093-0201
Running title: Elasmobranch VEP and ERP dynamics
Correspondence to:
T.H. Bullock
Dept. of Neurosciences 0201
University of California, San Diego
9500 Gilman Dr.
La Jolla, CA 92093-0201, U.S.A.
Ph: 619/534-3636; Fax: 619/534-3919;
E-mail: tbullock@ucsd.edu
Key words: Evoked potentials; Omitted stimulus; Thornback ray; Elasmobranch
Abbreviations: EEG, electroencephalogram; EP, evoked potential; ERP, event-related potential; F, frequency; IR, induced rhythm; ISI, interstimulus interval; LFF, lowest fusion frequency with no ripple in the averaged response; OSP, omitted stimulus potential; P75, positive peak at 75 ms; SSR, steady state response; UFF, uppermost following frequency for 1:1 response insingle sweeps.
|
|
Abstract |
|
|
|---|
To characterize the dependencies of ERPs in lower vertebrates and brain levels upon recent history and sequences of stimuli, trains of flashes were delivered at various frequencies to unanesthetized rays while recording in optic tectum and telencephalon. ERPs to repetitive stimuli cannot be understood in terms of simple refractoriness and recovery. Processes must be invoked such as simultaneous excitation and suppression, facilitation and its opposite, rebound and induced rhythms, each with development and decay times and nonlinearities. Some of these processes are uncovered by omitting a stimulus from a train. Omitted stimulus potentials (OSPs) act as though the brain expects a stimulus within 5-7 ms of the interstimulus interval (ISI) of the train. Very few ISIs suffice. The effect upon VEP form and duration of the number of stimuli in short trains, before the steady state response (SSR) is established, is complex. Alternation of the amplitude of successive VEPs (1 large every 2 VEPs, 1 in 3, 1 in 4) is one indication of complexities in the SSR. OSPs also alternate. A single extra stimulus interpolated into a regular train causes distinct effects according to its position. Sharp discontinuities in these effects appear with <5 ms shifts. Total power of the SSR decreases with stimulation frequency but there is a large peak of increased power at 7 Hz and another at 12 Hz. Induced rhythms are a labile, late phase of OSPs as well as of rested VEPs and of the OFF response to a long light pulse. Jittered ISI experiments show that the apparent expectation of the OSP is little affected and that the intervals in the last few hundred milliseconds are most influential. The OSP studied here (ISI <0.5 s)is quite different from that so far studied in human subjects (ISI >1s). We predict further similarities when each taxon is tested in the other ISI range.
A major category of response characteristics, besides sensitivity, receptive fields and recovery times, is dependence upon recent history of iterative events, including intervals, delays, omissions and perhaps multiple facilitating and forgetting time constants. The variables examined parametrically in this study are only some of those available. Such dynamical characteristics are important neglected properties of afferent systems at each level.
|
|
Introduction |
|
|
|---|
Under natural conditions sensory systems are stimulated on a background of previous stimuli, without the long rest periods common in the physiology laboratory. Our preliminary tests showed unfamiliar and unexpected effects of recent stimulation upon simple evoked potentials (EPs) as well as those related to paradigms that accompany cognitive events in humans. We will use the term event-related potential (ERP) for the latter class. The aim of this study is to uncover a little more completely the dependencies of these signs of brain response upon prior activity, by a systematic use of short trains of equal stimuli, with occasional omissions or extra stimuli injected. We consider this as a part of the larger question of the dependence of neural response upon temporal pattern of input.
In a previous study of the same species, Bullock et al. (1990) found that conspicuous ERPs are evident in single sweeps in response to occasional omitted flashes in or at the end of a conditioning train of flashes. These complex wave packets, including an early fast, later slow and still later oscillatory components were called omitted stimulus potentials (OSPs). They occur in a wide range of neural levels - in the cerebrum, optic tectum and retina. They behave in relation to different conditioning ISIs as though the system has an accurate expectation of the due-time of the missing stimulus, i.e. the latency after the due-time tends to be constant for various ISIs. Prechtl and Bullock (1994) found the same features in a species of reptile. In another modality, similar behavior of responses to physiological electrosensory stimuli in elasmobranchs showed the temporally specific expectation is not peculiar to vision (Bullock et al. 1993).
Species differences in the UFF - the uppermost frequency of 1:1 following and in the LFF - the lowest frequency of fusion by the criterion of midbrain evoked potentials (Bullock et al. 1991) aided in choosing iteration ranges. Differences in facilitation or its opposite as between sensory modalities, after the third or fourth or fifth iteration of a stimulus were noted in brainstem evoked responses in elasmobranchs by Platt et al. (1974).
The domain in question includes the literature on sensitivity to different patterns of stimulation at the same mean frequency. Wiersma and Adams (1950) and Ripley and Wiersma (1953) were the first to note that some neuromuscular junctions are highly sensitive to temporal pattern; others are not. Rao et al. (1969) cite other early papers. Grossberg (1970) provided a survey of the topic of temporal pattern discrimination in neural systems. Schreiner and Langner (1988) and Feng et al. (1990) dealt with the coding of temporal patterns in the central auditory system. Most of the literature on temporal pattern concerns reports of patterned activity of neurons and how it can be generated. Temporal pattern has been recognized as a candidate neural code (Perkel and Bullock 1968) but the differences in response to even such simple variables as the number of successive stimuli and their interstimulus interval (ISI) has seldom been studied.
The present work extends our previous study by a closer examination of the dynamics of repetition of stimuli, tested with omissions and extra stimuli. It will show that cumulative, time-dependent and sequence-dependent, interacting inhibition, facilitation, rebound and oscillatory processes are involved in responses to temporally patterned input.
|
|
Methods and Materials |
|
|
|---|
Small thornback rays (Platyrhinoidis triseriata) and stingrays (Urolophus halleri) were used at approximately their normal sea temperature (15C). Good preparations, stable for many hours, were made on 27 rays. Under anesthesia with 1:10,000 MS 222 (tricaine methane sulfonate) the brain was exposed. Pavulon (0.2 mg) was injected intramuscularly in the tail to prevent casual movements and the fish was fixed in a gently restraining holder. The ray was suspended above the floor of the bath and immersed to a level that left the eyes and the surgical opening in the cranium out of water but almost all pores of the ampullae of Lorenzini under water and unobstructed. The bath was 594 x 350 mm and the water depth 69 mm; the water in the tank was ca. 14.3 liters but an additional few liters was circulating through a cooling coil immersed in a refrigerated bath. Air was bubbled continually. Water flow through the gills was checked by injecting a small volume of methylene blue solution into the inflow tube to observe where and how fast it emerged from the mouth and gills. A sponge rubber plug occluded the spaces around the mouth tube to impede outflow through the mouth. After the surgery and mounting the fish was left to recover and equilibrate for 30 min.
Recording electrodes were tungsten needles, insulated to the tip (F. Haer Co.), having an impedance at 20 Hz of ca. 1 M or less when intended for compound field potentials, or 2-2.5 M for multiunit spike recording. In the former case brain activity was bandpass filtered (Rockland model 452) from 0.3-100 Hz; for multiunit activity (MUA) from 50-1,000 Hz. Four electrodes were placed for the EEG recording, in the right and left optic tectum at depths of less than 0.5 mm, and in the right and left telencephalon at 1-1.5 mm.
Visual stimuli were 8 µs strobe flashes (Grass PS 2) or glow modulator pulses controlled by computer (PDP 11/73 or BrainWave, Broomfield, CO). The EEG data were monitored by analog and digital oscilloscopes and an on-line averaging computer (Nicolet 1170) during the experiment and analyzed and plotted off-line. MUA was stored on tape and played back for analysis. Visual stimuli were delivered to the eye contralateral to the tectal recording locus via a light pipe; small pieces of tissue paper were put on both eyes as diffusers.
To monitor the animal's condition, its color, respiration and especially the responses to stimuli were examined periodically. At the end of an experiment the ray was euthanized by an overdose of anesthetic and the placement of electrodes verified visually. Histological localization of responsive areas has already been done, by Bullock et al (1990).
|
|
Results |
|
|
|---|
VEPs include both the well rested responses to light delivered at long ISIs and the SSRs to repetition at rates that do not permit full recovery. OSPs are responses after omission of single flashes or after the end of a train of flashes, that are not attributable to the preceding flash, that is, responses that add something to the SSR.
Findings on the aims stated in the Introduction are divided initially into those concerning dynamics of visual evoked potentials (VEPs) and those on omitted stimulus potentials (OSPs), followed by overlapping and special aspects. When it is not stated otherwise, the results are from recordings of responses in the optic tectum.
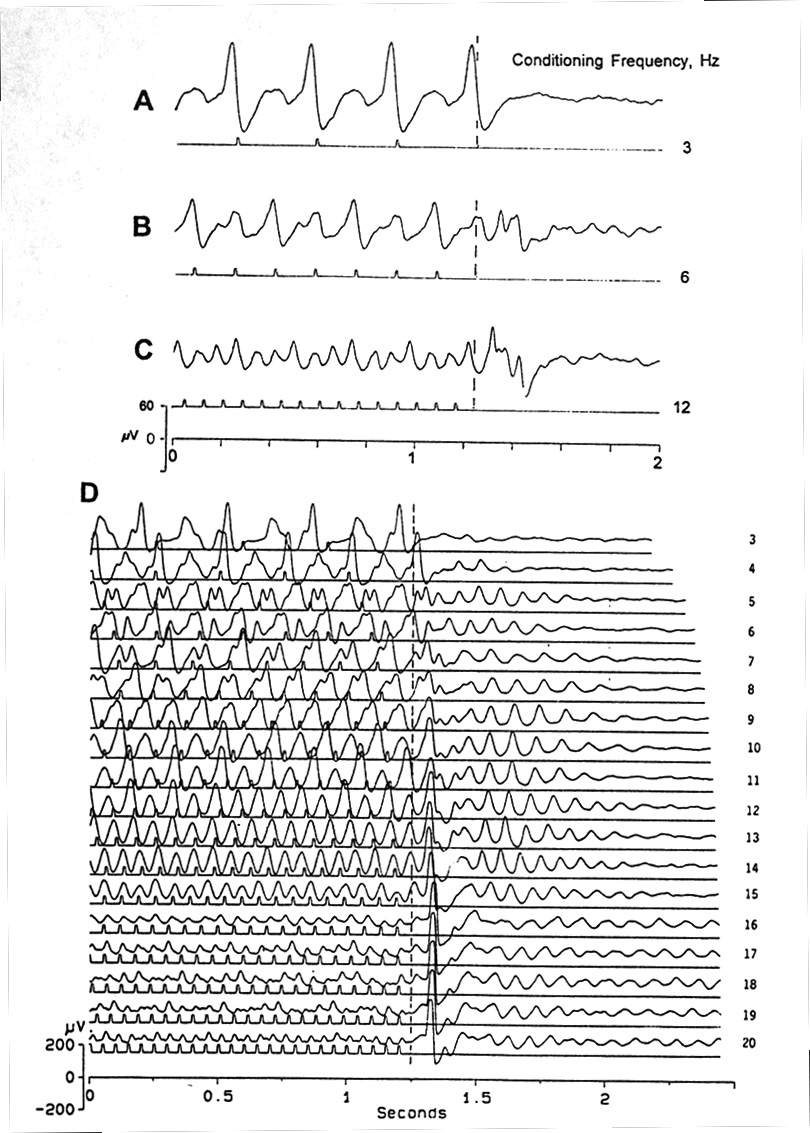 |
Fig. 1. VEPs showing alternation of amplitudes at different stimulation frequencies, during the steady state response (SSR), and OSPs after the end of the train of flashes. Traces are aligned by the due-time of the first missing flash (dashed line). A: 1:1 VEP following at 3 Hz with the late wave large = P300; no OSP. B: every other VEP is larger ("1-in-2") at 6 Hz; after the last VEP, which is one of the smaller type, the missing flash (which would have caused a large VEP) releases a relatively modest OSP, with a double peak, the first one at P100, the second at P167, and with later oscillations. C: 1-in-3 VEP at 12 Hz; large and complex OSP beginning with P73. D: Another preparation; 1-in-4 VEP at 16-19 Hz; the basic period is about 250-330 ms which is about the total duration of a single flash VEP (see Fig. 2). OSP begins at 4 Hz as a feeble, late oscillation and at 7 Hz as a novel peak of fixed latency (P100) after due-time, converging at higher frequencies to P75-85. Platyrhinoidis, tectum, averages of 32. |
A. Visual Evoked Potentials
A1. Single and repeated flashes. The VEP in elasmobranchs, as already known (Platt et al. 1974, Bullock 1984) chiefly from the superficial tectum is a complex response that has relatively sharp first or "early" (P90-110) and second or "late" (P240-340) main peaks, each followed by a slow wave; a still later oscillatory component is labile and often not seen. The telencephalic locus that responds to flashes in Urolophus shows two main peaks, ca. 15-35 or more ms later than the tectal peaks, and shows no induced oscillations either in averages or single sweeps. It must be remembered that this could mean oscillations are present but smaller than the ongoing cerebral EEG and too incongruent in successive trials to build up in averages.
Responses are quite similar in different animals although variability of form in VEPs and OSPs is considerable, chiefly due to electrode position. The VEP varies in amplitude as well as form, especially with depth; the OSP varies mostly in size, and more with topographic position. OSPs from the best of our loci still vary but the evidence of micromanipulation is that a major part of this is still due to the exact locus; we cannot search for the very best locus without making several tracks and risking damage. Small variation in latency of peaks can also be affected by the position of the electrode, as well as by other factors, largely unknown. We do not present means and variance because the assumption that the measured entities are strictly comparable is not justified with microelectrode recording in the tissue.
The VEPs in some preparations do not change in amplitude or form as intervals between flashes are reduced from ISI = 30 s to 1 s, under our conditions, in either tectum or telencephalon; in others of our preparations complete recovery can require 5 s. We can only speculate that the rays brought in from the ocean are not all in the same condition, although they look healthy and act normally. At 2 Hz and higher frequencies, VEPs begin to lose amplitude and stabilize (Fig. 1) at a steady state response (SSR) already with the second response. The first main peak of the VEP (P90 to 110 at 15-17C) in both tectum (Figs. 2, 5) and telencephalon (Fig. 5), which is still large at 1 Hz, becomes smaller at 2 Hz, while the second main peak (typically P250 in tectum, N320 in telencephalon) becomes larger, sharper and later. At 3 Hz, the prominent part of the VEP is the second peak (Fig. 1); the first peak disappears and we can see only a slow wave arising just after the stimulus and coming to its maximum at about 125-140 ms. The amplitude of the late component (second peak) remains unchanged at 3 Hz. At 4 Hz it tends to get smaller and a smooth early small wave appears. The most important parameter for these early and late components is the intensity of the stimulus; if it is low, the most prominent part of the VEP is the second peak. As the stimulus intensity is raised, the early component appears and increases while the late component becomes smaller and disappears.
A second flash given 40 to 150 ms after the first one adds only a late component. It will be of interest shortly below to note that its latency is like that of an OSP. If the ISI between first and second stimulus is 200-250 ms, the responses still overlap, the delayed late component of the first VEP has a reasonable latency for being considered an early component of the second VEP. With still longer ISIs, the late component suddenly becomes smaller and VEPs become clearly separated, the amplitude of the second one being smaller. Around 1 s ISI total recovery develops under our conditions.
A2. Effects of stimulus parameters. Room light and flash intensity, of course, influence both VEP amplitude and latency. Amplitude becomes larger and shape changes with higher intensities, up to a maximum. VEP peak latencies are reduced with flash intensity within limits; the effect is maximum in low intensities. The differences between minimum and maximum latencies are ca. 15-20 ms. The effect of room light level on VEP latency is less than 12 ms. Absolute values of light flux depend on the state of dark or light adaptation, the recent history of stimulation and the form of illumination, among other factors. The experiments to follow were controlled to the extent that flash and ambient light intensities were well above threshold and below saturation levels and were consistent day after day in any series of tests.
Flash frequency has complex effects, depending on the recent history including the duration of a train of flashes. The amplitude of the highest peak decreases after the first response following a rest period and comes to a lower steady state response (SSR) after the second stimulus, at any frequency within the 1:1 following range. A further slow decline in SSR height may continue for tens of seconds (Fig. 2 of Bullock et al. 1991). The peak height of the SSR decreases as frequency increases, beginning at ca. 0.2 Hz and continuing through the 1:1 following range. The amplitude decrease is more than proportional to the decrease in interstimulus interval so that the total power of the SSR decreases with ISI. (Power can be measured either as area under the curve, on either side of zero, ignoring sign, or as RMS voltage or by the Fast Fourier Transform.) There is, however, a large peak in power at 7 Hz and another at 12 Hz indicating a possible resonance or a change in shape that might include late components.
The uppermost following frequency (UFF) under our conditions of ambient light and flash intensity at 15-17C, is 10-13 Hz in Platyrhinoidis (Bullock et al. 1991), ca. 19 Hz in Urolophus (this study). At flash frequencies above the UFF the VEPs (not averaged) become irregular and "sputter" - a large VEP occurs now and then, smaller ones intermittently until the lowermost fusion frequency (LFF) is reached, when no sign of a ripple in phase with the stimulus train can be seen in the average. In Platyrhinoidis the LFF was reported to be >30-60 Hz under our conditions (Bullock et al. 1991).
Late components behave quite differently from the foregoing, early main peak. The most prominent is P250, the second main peak described above. It can be present or absent, depending on still unidentified factors. When absent in a rested preparation it may appear and become larger during two minutes of continuous flash stimulation at 1 or 2 Hz. After a rest period of about 15 min. this late component needs about 60 s to come to its maximum size at 1 Hz, and perhaps a little less at 2 Hz. This relation suggests that the stimulation period is more important than the number of stimuli. With repetition, after the first 2 min. of stimulation, the VEP comes to its maximum faster. Below (C.) we report the conditioning effect of flashes to one eye when tested by the other eye.
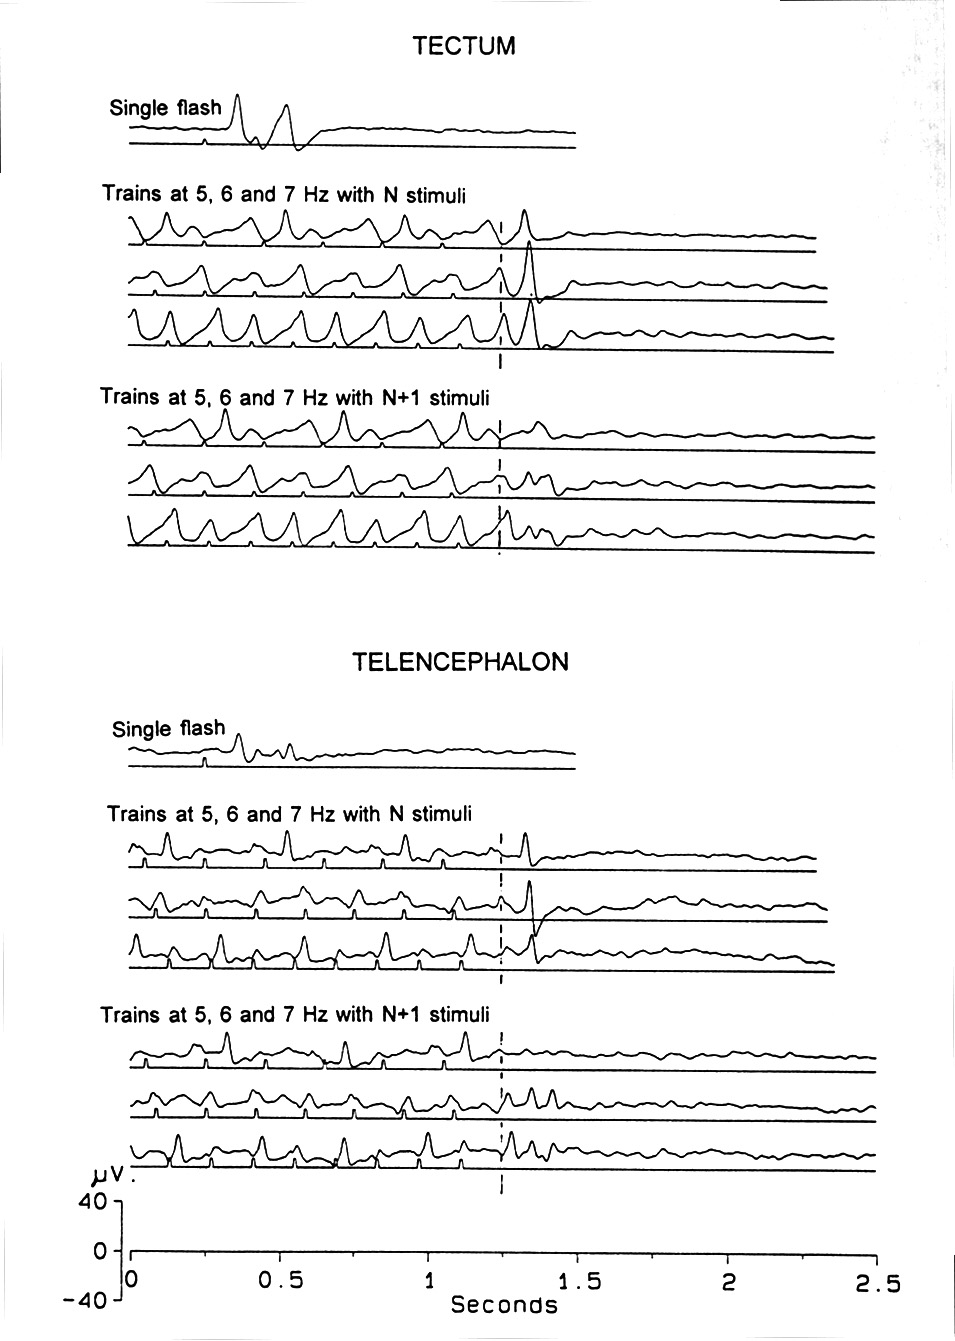 |
Fig. 2. VEP and OSP, parts of a frequency series showing alternating amplitudes of VEPs in critical ranges and of OSPs by ending a train after an even or an odd number of stimuli. Lower set of traces for each conditioning frequency contained one more stimulus than upper set. Note the dependence of the amplitude and shape of the OSP upon the phase of the concurrent VEP. For comparison, the single VEP is shown. Platyrhinoidis, tectum and telencephalon, averages of 32. |
Alternation of successive VEP amplitudes and latencies is usual at certain flash frequencies. Equal amplitude, 1:1 following extends from the lowest frequencies up to ca. 5 Hz, the 1-in-2 alternation (large VEPs every other stimulus) from 5-8 Hz, 1-in-3 from 8-12 Hz, 1-in-4 from 16-19 Hz (Fig. 2). Above 19 Hz, the SSR is nearly a regular sinusoid. In the telencephalon, 1-in-2 following is visible but 1-in-3 and 1-in-4 are not, perhaps because the amplitude of the response is smaller here and the signal to noise ratio is lower than in the tectum. At 20 Hz, the SSR looks irregular - the UFF is just below 20 Hz in this species, Urolophus.
The first stimulus always causes a large response. Alternation tends to start at the beginning of the stimulus train, independent of flash intensity. With maintained F the ratio is maintained so that whether a given VEP will be large or small can be predicted from the index number of the stimulus. The index numbers of the stimuli that cause large responses can be formulated as follows:
Index Numbers (flash evoking large VEP) = 1 + k x n, where k = a following constant, the second number in the foregoing ratios, and n = the whole number of cycles of k stimuli. In other words, if the (Index Number) mod (k) = 1, that stimulus will cause a large VEP.
The effect of number of stimuli in short trains, before the SSR is established, is complex. At 10-20 Hz, increasing the number of flashes in steps of one, from 1 to 6, duration of the total response to the train only increases up to 2 stimuli at 10 Hz, 3 stimuli at 15 Hz and up to 4 stimuli at 20 Hz, after which, adding one more stimulus results in a sudden decrease in the total train response duration (Fig. 5). Before that point, the total increase in response duration for each stimulus is ISI/2 and after the sudden decrease, the total response duration increases with additional stimuli by one ISI (Fig. 5). The latency of the early component of the 2nd, 3rd and later VEP responses is shorter than that for the first flash.
Multiunit spike activity (MUA), in the tectum and telencephalon was recorded in 11 animals. MUA generally follows stimuli in a 1:1 burst fashion up to 13 Hz. There are, however, small spots in the brain that follow only up to some slower frequency in the range of 6 to 13 Hz. The MUA in most spots follows 1:1 until some limiting frequency and then suddenly becomes silent. At such a time an extra stimulus causes a response like that to a single flash. There is no alternation in MUA audible in the audio monitor at the frequencies that give clear alternation of compound field potentials (VEPs).
Dark "flashes" - one missed flash at 64 Hz - given 4, 8 or 16 times per second cause SSRs quite similar to light flashes, but at an earlier phase and with a simpler form. Dark flash VEPs also alternate in amplitude and in latency at the same stimulation frequencies as light flash VEPs.
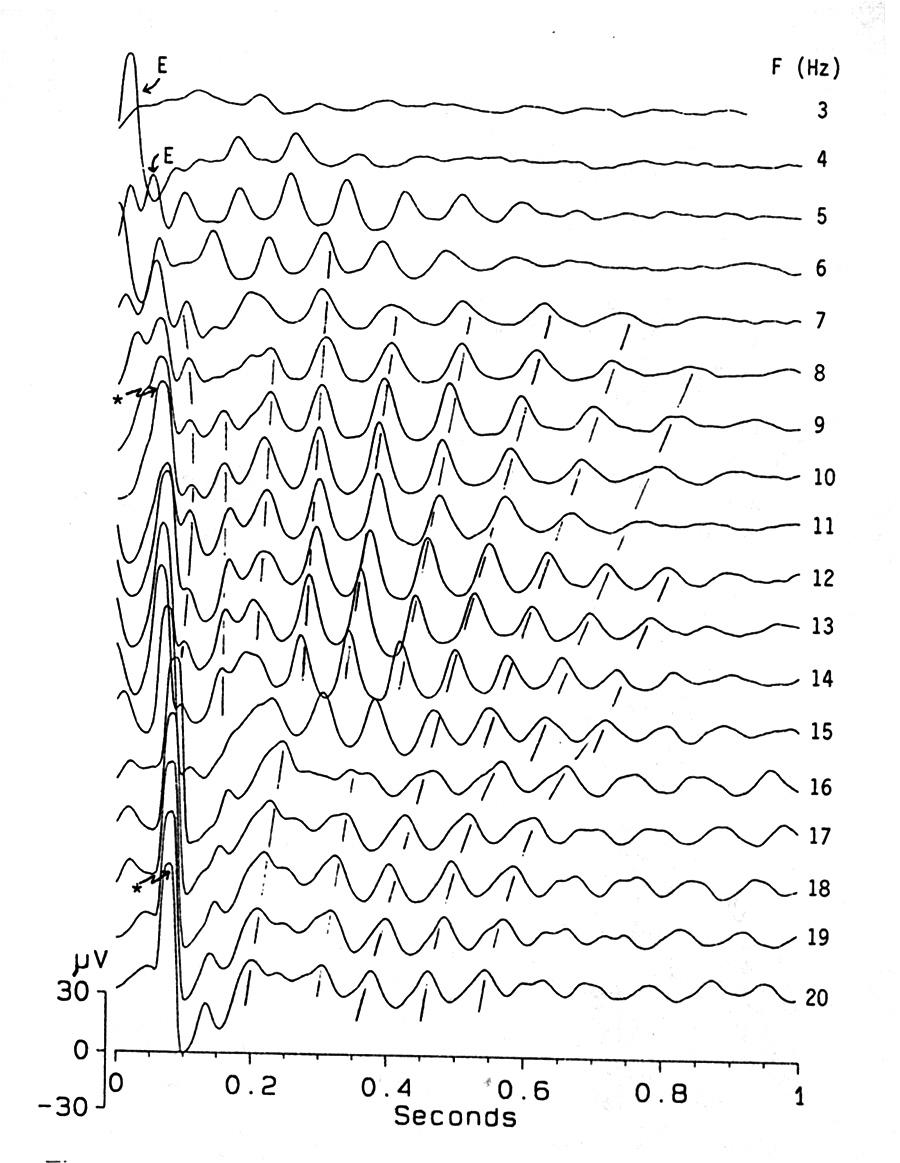 |
Fig. 3. Induced rhythms (IR) are a labile late component of the omitted stimulus potential, often visible at a lower conditioning frequency than a clear, early OSP. The beginnings of the traces in this experiment correspond to the due-time of the first missing stimulus after a conditioning train at the indicated frequency, i.e. one ISI after the last stimulus. To help in identifying the early waves after the due-time, some of them are marked: VEPs, repeating what was seen after each flash in the train, with "E"; OSPs with an asterisk. In a given experiment the induced oscillation has a nearly fixed frequency, usually between 13 and 25 Hz. This frequency falls slightly with time, in the first second after the end of a train and also falls with lower flashing rate in the conditioning train. Note discontinuities in these effects, brought out by the hand-drawn dashed lines. In this series, between 8 and 14 Hz conditioning rate the IR frequency, averaged over the first 3 large cycles, increases from 9.8 to 12.9 Hz Platyrhinoidis, tectum, averages of 32. |
B. Omitted stimulus potentials
As reported elsewhere (Bullock et al. 1990), if a flash is omitted or is late or a train of flashes is terminated, a special response is seen, over and above that attributable to the last flash; this we term the omitted stimulus potential (OSP). The components of the OSP to different stimulation frequencies are different. We see no response after low frequency (<1 Hz) conditioning trains. Only when F >1 Hz is it easy to see something and it becomes conspicuous as F increases. The OSP around 5 Hz appears as a simple early wave (P65-100; Figs. 1,2). With higher frequencies this wave becomes larger and sharper, followed by a slow wave and even later oscillatory components. A transition in the waveform occurs between 11 and 14 Hz in Fig. 3, (between 8 and 10 in Fig. 1D). The induced oscillations are quite labile and variable in frequency and duration. In the tectum of rays the oscillations are of 5-7 or of 15-25 Hz, typically one fixed frequency for a preparation, independent of flash intensity, flash frequency and train duration. The duration of oscillation increases with flash frequency between ca. 7 and 15 Hz and with train duration preceding an omission. The oscillations become more regular and time locked to the due-time of the omitted stimulus around 8-14 Hz and may then become more irregular above 15 Hz.
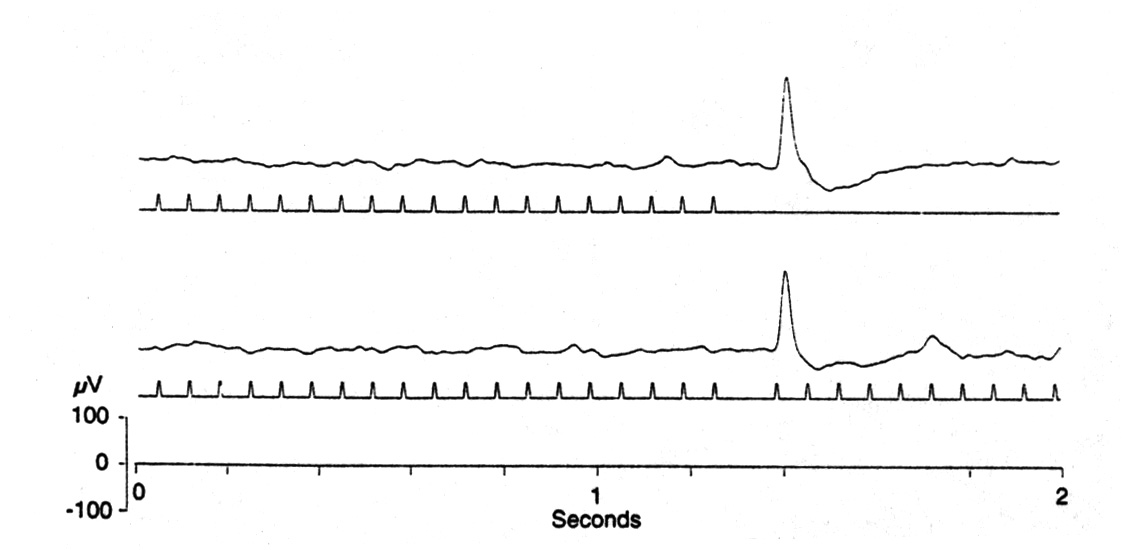 |
Fig. 4. Comparison of OSP after the end of a train and after omission of a single stimulus in a train, at 15 Hz. The second, slower, negative wave is somewhat larger after a train ends, as here, and in most experiments, unlike this one, an induced oscillation extends for about a second (see Fig. 3). Platyrhinoidis, tectum. |
The responses to the end of a train and to the single omitted stimulus in a train look quite similar; Figure 4 shows samples at 10, 15 and 20 Hz conditioning flash frequencies. The same can be said for the single delayed stimulus in a regular train. An ISI 5 ms longer than the regular ISI can trigger a good ERP consistent in latencies and form with an OSP.
B1. Train duration and stimulus number. The length of the conditioning period between 30 s and 0.5 s has only a modest effect on the shape and the amplitude of the OSP main wave, conditioned by 6 to 20 Hz stimulation. In some stimulus frequencies, 1 s conditioning gives a larger OSP than 0.5 s conditioning but the shape is the same and the OSP is almost the same size with conditioning periods of 1 s or longer. The induced oscillation can be longer lasting after 10 s conditioning than after 4 s, and still longer after 25 s (Bullock et al. 1990).
The minimal number of stimuli in short trains (Fig. 5)is mainly dependent on the requirement of the definition of an OSP that it is something new, not attributable to the last flash; hence it requires that the VEPs to successive flashes have reached a steady state response (SSR). At optimal flash frequencies of about 15-20 Hz this means about 6 flashes. A wave of the same form and latency as the clear OSP can be seen after shorter trains. Two stimuli are enough to generate a wave with a latency like that of the OSP.
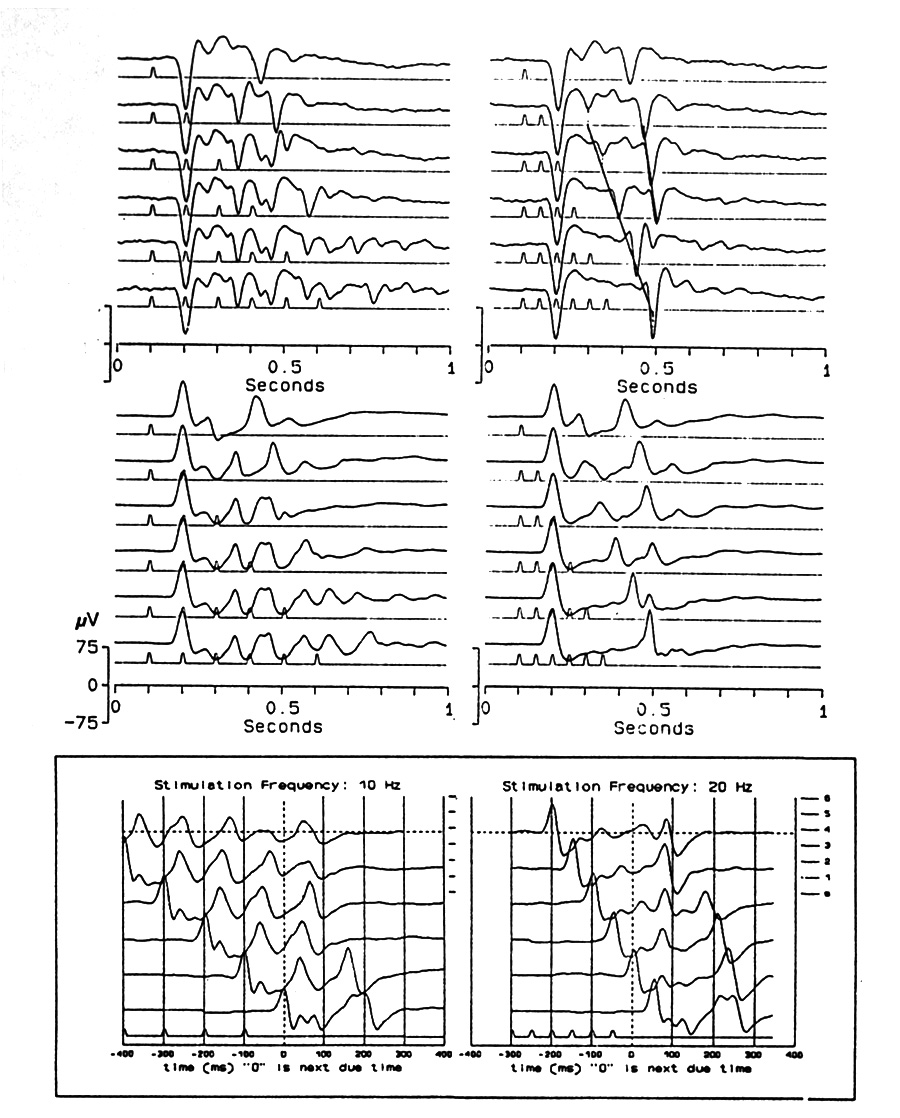 |
Fig. 5. Comparison of single flash, pairs and short trains up to 6 flashes at ISI=100 ms (left), and 50 ms (right.) Successive traces show responses to a single flash, 2, 3, 4, 5 and 6 flashes. After a train of 6 there is a clear OSP at P93 from the due-time of the first missing stimulus; a positive peak at the same time is seen in each of the shorter trains, including that with only two stimuli. It cannot confidently be called an OSP except after the 20 Hz trains of 6 and 5. In order to study what is happening, it helps to align the traces by the due-time of the first missing stimulus (boxed traces, which are reversed in sequence, the single flash at the bottom). Urolophus, tectum (below) and telencephalon (above), averages of 32. |
B2. Effect of stimulus frequency. The amplitude of the OSP increases at higher conditioning frequency, unlike the VEP which becomes smaller and disappears. Under our conditions the rays show no OSP at frequencies <2 Hz; the just visible OSP at 2 or 3 Hz grows to a conspicuous response in single sweeps at 4-8 Hz. In a transition zone between 9-12 Hz the OSP may be smaller (Fig. 2A).
Latency of the OSP is almost constant after the next due-time. Small latency changes occur in different stimulation frequencies: OSP latencies to higher conditioning frequencies are longer than to lower frequencies, those differences being <40 ms in the stimulation range of 8-20 Hz.
OSPs also alternate when VEPs alternate 1:2, although less (Fig. 2). Thus the amplitude of the OSP depends on whether the train had an even or odd number of stimuli. If alternation of VEPs is clear, absence of the stimulus which would have caused a large VEP generally tends to cause a small OSP.
Dark flashes (Fig.6) above 4 Hz cause OSPs quite similar to light flashes, but the latencies tend to be longer. The latency of the OSP response from the due-time is always less than the latency of the EP at that stimulation frequency, in the paradigm of light flashes. But the latency of the OSP in the dark flash paradigm is almost equal to or a bit longer than the latency of the steady state VEP. Dark OSPs look like the continuation of steady state VEP with increased amplitude (no phase change). But with light flashes, the OSP response look as though phase is changing.
 |
Fig. 6. Comparison of dark and light flash VEPs and OSPs. Upper traces are dark flash responses. Low intensity continuous light (glow modulator output 200-600 lx, ambient light 10-50 lx) is interrupted for 10 ms to create dark flashes. Lower traces are 10 ms light flashes of the same intensity; obviously total light flux is different. Note the alternation, beginning with 5 Hz light flashes; at 6.7 Hz dark flash EPs are 1 large in 2; light flash responses are 1 in 3; at 10 Hz both are 1 in 2; at 13 again dark flashes are 1 in 2 while light flashes are 1 in 3; at 20 Hz dark flash EPs are 1 in 2 with the smaller one invisible, light flash responses look as though they have reached the LFF. Platyrhinoidis, tectum. |
The effect of jitter of ISI is of interest in comparing the OSP to a meaningless omission in rays with the task-related, attended and unpredictable missing stimulus in humans where the regular conditioning series creates a real expectation of a flash on schedule (Bullock et al., 1994). Not surprisingly, jitter acts quite differently in rays; it does not decrease the OSP markedly, if we align the single sweeps or the average by the due-time of the first omitted flash, assumed to be the mean interval after the last flash and if we make the last interflash interval also equal to the mean (Bullock et al. 1990).
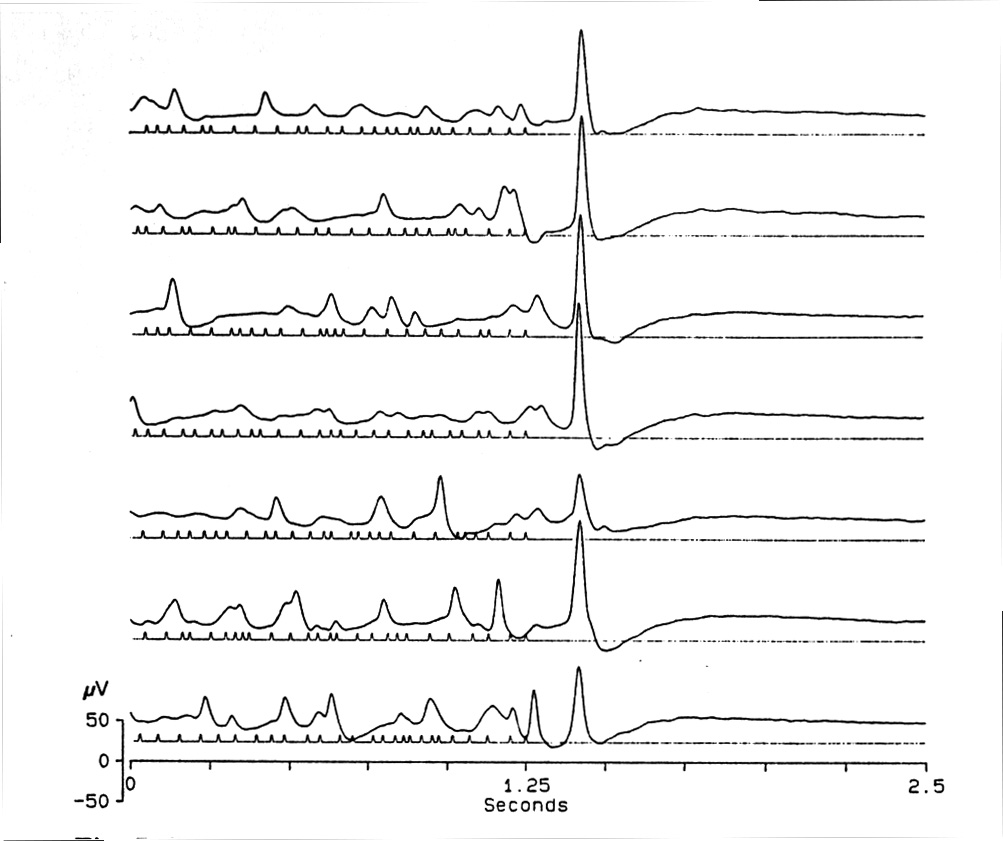 |
Fig. 7. Effect of jitter of ISI. Mean ISI = 50 ms, jittered between 25 and 75 ms with the last ISI always = 50 ms. Under this condition, the OSP is similar for many different jitter sequences. If the last ISI varies, it has a large effect on the OSP. Platyrhinoidis, tectum. |
Closer analysis shows the importance of the last few intervals and of the preceding mean interval (Fig. 7). Different jitter series with the same mean ISI were performed systematically changing the last ISI (mean, 100 ms, low jitter = 80-120 ms, high jitter = 50-150 ms; mean, 67 ms, low jitter = 55-80 ms, high jitter = 33-100 ms; mean, 50 ms, low jitter = 40-60 ms, high jitter = 25-75 ms) . The result showed that the last ISI has a large effect on the amplitude and the form of the OSP. In another paradigm, the ISIs in the last 50, 100, 150, up to 400 ms of the conditioning train were jittered, but in one or another of several fixed sequences, repeated for each of the consecutive trains, while the preceding ISIs were jittered in an incongruent series for the same consecutive trains (Fig. 7). This revealed the minimal necessary history which can influence the OSP, given the same mean ISI. The results showed that a period of ca. 250-300 ms can define totally the amplitude and the shape of the OSP.
There is no meaningful average response to fluctuating ISIs. Two stimuli are enough to create a conditioning that causes a response at the time of an OSP, as though it were triggered by the due-time of an expected third stimulus (Fig. 5). Therefore, it is easy to see this response even after a jitter series. There are clear OSP components that follow a systematically changing last ISI after different jitter patterns.
C. Binocular interaction in VEP
There is no interaction in the tectum between right and left eye flash stimulation judging by early components of the VEP (or by the OSP). We find an interaction, however, for the late components, by a simple experiment. After a rest period (ca. 2 min), if we stimulate one eye, the late component of the VEP appears. At one or two Hz it becomes larger with time, for example reaching >300% of its initial height in 60 s. Now, after another 2 min rest, if we stimulate either the same or the other eye, we need about the same time to see the large, late component reach 300%. But, if we stimulate one eye until we see the large, late component reach this height and then suddenly stimulate the other eye, stopping the stimulation of the first eye, we may see the large, late component immediately, manifesting an interaction between sides. Conditioning one eye can affect the development of the late component of the other eye's VEP. Since we showed that the early components of the VEP responses to right and left eyes do not interact, we can conclude that the late components of VEPs are generated differently from the early ones and may contribute to some different or additional functions.
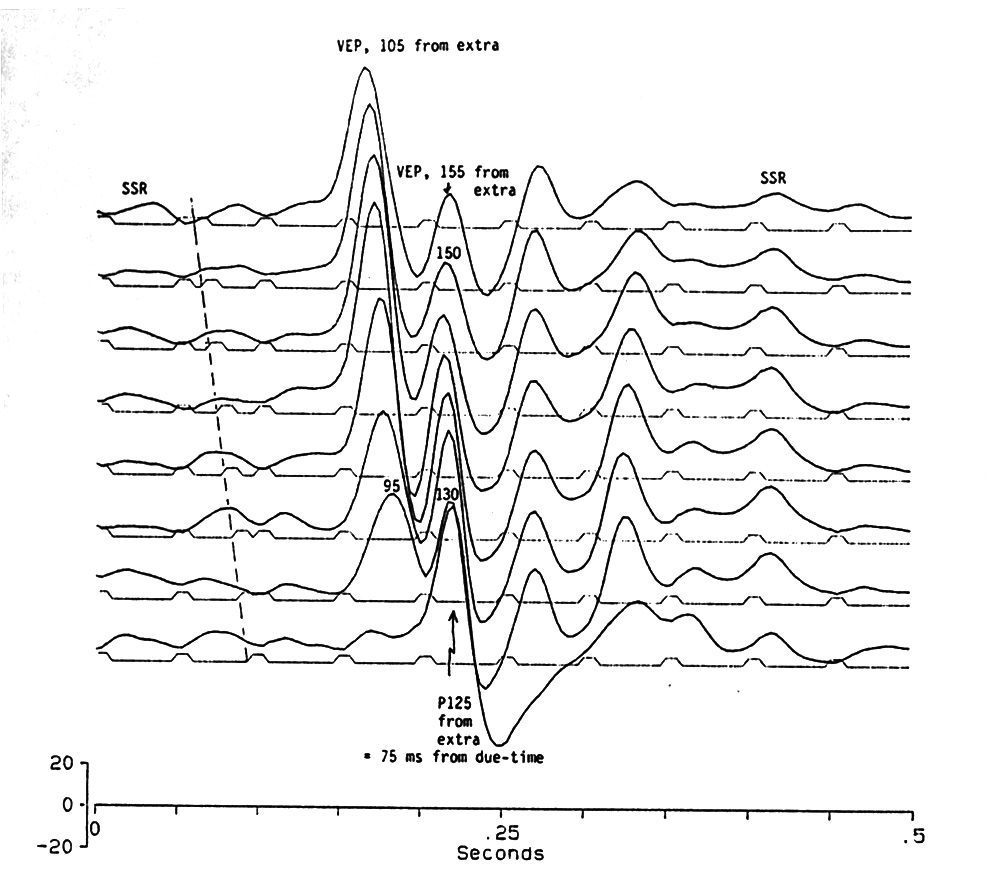 |
Fig. 8. Effect of an extra stimulus inserted at different times during continuous regular stimulation at 20 Hz. The oblique dashed line at the left shows the onsets of the extra flashes inserted. Rising from the small SSR, the Complex Event Related Potential (CERP of Makeig and Galambos 1989) is similar to a single flash VEP with an oscillation time-locked to the regular stimuli, independent of the extra one, as though the extra flash causes a 150-200 ms disinhibition of the low amplitude SSR. Note the abrupt discontinuity between the last and the next to last traces. The 10 µs flashes occur at the beginning of the stimulus markers which are prolonged for clear visibility. Platyrhinoidis, tectum. |
D. Extra stimulus inserted in a train
Figure 8 shows a systematic series in which a single extra stimulus was interpolated into a regular 20 Hz train at different times, in 5 ms increments, during the normal 50 ms ISI. The extra flash was similar to those of the regular train and the insertion was made after 41 regular flashes, during the low amplitude, sinusoidal SSR. The effects critically depend on the position of the extra flash; sharp discontinuities appear with 5 ms shifts.
If the extra stimulus comes just after a regular one (5 ms), it has no effect (not shown in Fig. 8); the retina or central mechanism acts as though something is refractory. If the extra stimulus is 5 ms or more later (10-40 ms after the preceding flash), it causes a large response that looks like and has close to the same latency as a single flash VEP. In addition 3 or 4 cycles of 17-18 Hz oscillation gradually shift and subside to the low amplitude 20 Hz SSR. These oscillations are aligned almost vertically, at near normal VEP latencies after regular train flashes, whereas the first large peak is more closely time-locked to the extra flash, aligned obliquely with the progressively later positions of the interpolated stimulus. The oscillations act as though a 150-200 ms disinhibition or enhancement of the SSR can follow the extra stimulus VEP closer and closer up to a critical minimum of 35 ms peak to peak when the extra flash is 40 ms after a regular one. The next 5 ms increment, at 45 ms, causes a discontinuity.
If the extra stimulus comes 45 ms after the preceding or 5ms before the next regular stimulus, the VEP-like wave to the last regular flash is suppressed by the inhibition due to the extra stimulus and the hitherto second positive peak of the disinhibited oscillation is suddenly gone. A large peak lies precisely at the time of the hitherto first positive oscillation and acts like an ERP attributable to refractoriness of the next regular stimulus, since that comes after only 5 ms; the result is a 55 ms interval. This we have already found will cause an OSP in a 20 Hz train. Its shape also resembles an OSP in lacking the enhanced oscillation.
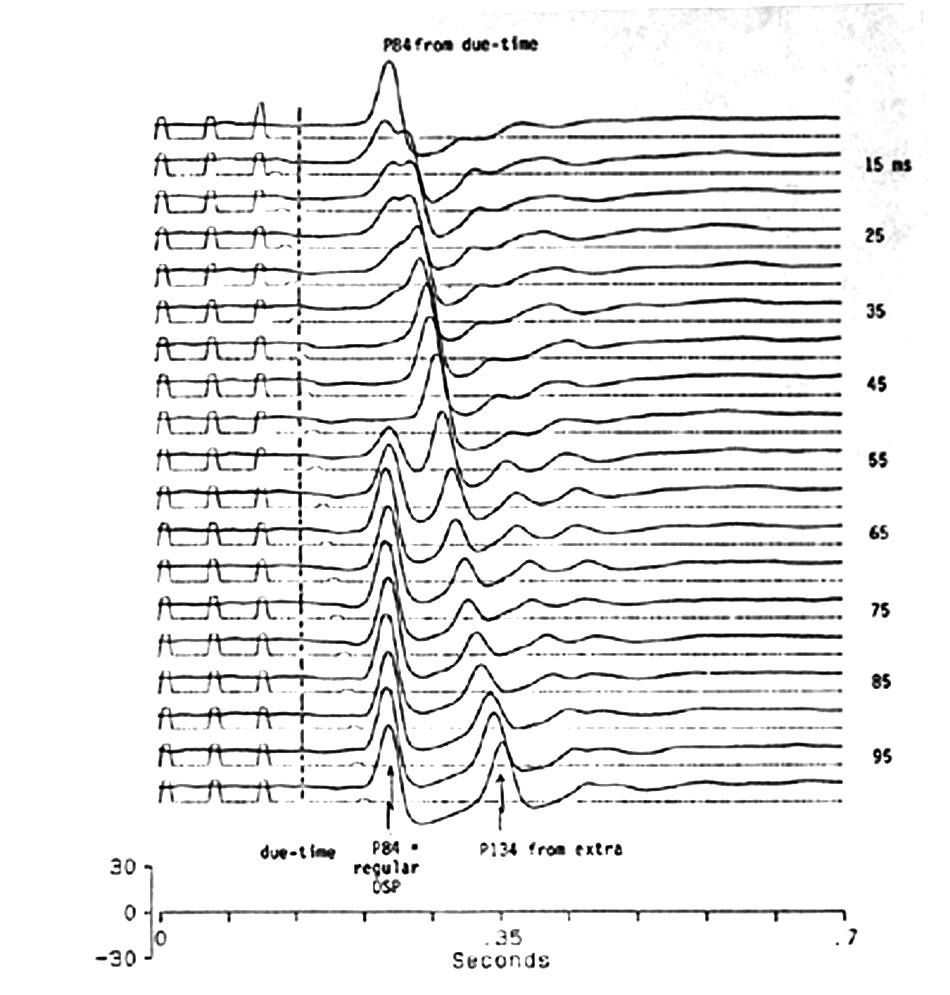 |
Fig. 9. The effect of an extra stimulus after the end of a 20 Hz regular flash train; it is physically very similar to the regular flashes, not substantially weaker although the marker is smaller. The dashed line indicates the due-time of the regular train. The last ISI is systematically increased, from the next-to-top trace to the bottom, from 15 to 100 ms in 5 ms steps. Note that the extra stimulus from 15-40 ms causes a second, later wave on the OSP, with the same latency after the extra flash as the control OSP is after the last flash (130-140 ms = 80-90 ms after the due-time of the first missing flash). It builds up and delays the onset and depresses the amplitude of the first, regular OSP wave. From the extra at 45-55 ms a normal OSP occurs, since the "extra" becomes simply one more stimulus in the normal train. From 60-100 ms a new, early OSP is on schedule for the last regular (50 ms ISI) flash and the second, OSP-like wave follows the extra stimulus at about the same latency as the regular OSP follows the last regular flash. The discontinuity at 50-55 ms shows that 5 ms can be critical in determining the OSP. Platyrhinoidis, tectum, averages of 32. |
Figure 9 shows the case of an extra flash after the end of a regular train. If it is inserted 5 ms after the last flash, it has no effect, as though the system were refractory. If >5 ms later the response is a mixture of VEP and OSP, again with discontinuities for 5 ms shifts. The extra flash at 25-100 ms causes a sharp peak after 134 ms, equal to the regular 50 ms ISI plus the normal 84 ms OSP latency from the due-time of the first missing flash. From 25-45 ms it progressively suppresses the OSP time-locked to the first missing flash of the regular train. At 55 ms that OSP suddenly reappears, grows larger at 60 and 65 ms and continues up to 120 ms after which the cycle is repeated. In a range from 60 to 90 ms (time of extra flash), the OSP-like peak 134 ms after the extra stimulus is reduced in amplitude from the maxima before and after that range. The last ISI does not determine the OSP latency as much as the preceding regular ISIs.
The critical sensitivity to 5 ms of ISI in certain ranges (Fig. 10) is independent of stimulus frequency over the range 8-20 Hz.
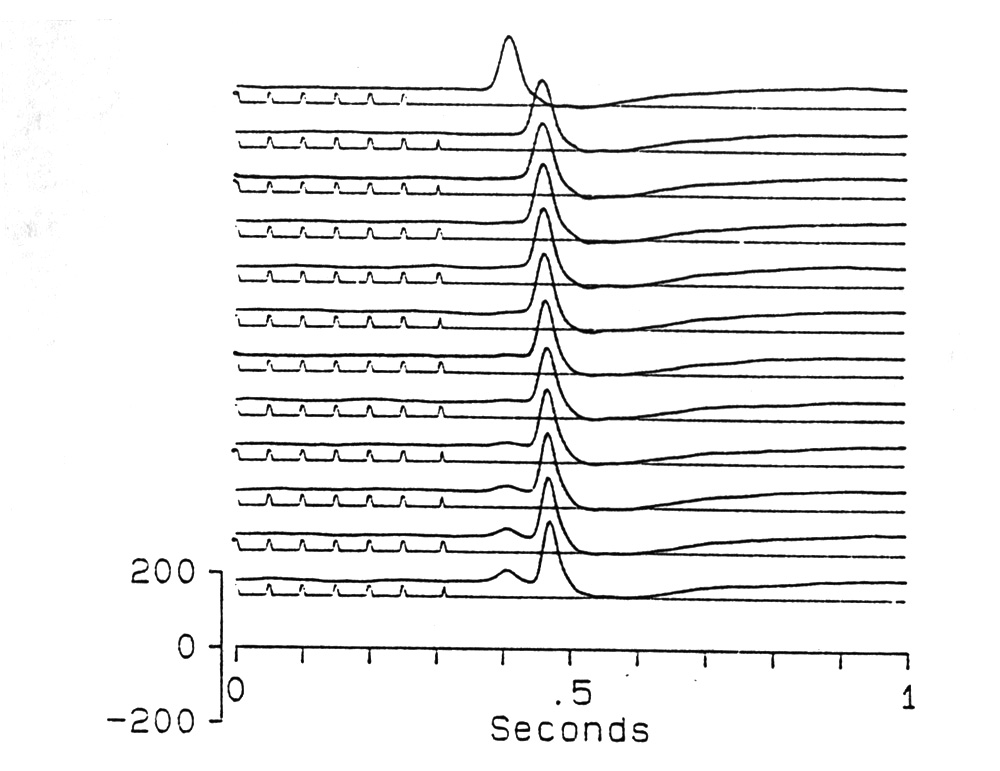 |
Fig. 10. Precision in determining the next due-time. First trace: conditioning with 50 ms ISI, 2 s regular train of diffuse flashes causes a large positive OSP peaking at P115 after the due-time of the first omitted stimulus. In the 2nd to 12th traces one more flash is delivered at 50, 51, 52, 53 .. up to 60 ms later. Note that at 57 ms (9th trace), without affecting the main P115, a small early wave of the OSP appears 90 ms after the 7-ms-delayed last flash; it grows larger with increasing delay. The minimum delay that causes the early OSP wave is constant at ca. 5 to 7 ms for different conditioning ISIs. Platyrhinoidis, tectum; averages of 32. |
E. Induced rhythms.
Some induced rhythms, time-locked to the missing stimulus due-time appear as a late component of the OSP. The rhythms are commonly congruent in successive trials, i.e. are without serious phase or frequency jitter and are thus seen in the average. The oscillation is similar over a wide range, at least 5-20 Hz, of stimulus rates. Oscillations last several cycles, generally for 0.5-1 s; they often slow down slightly during this time. In some preparations around 8-14 stimuli per second they may become quite regular and large, consistently in the range of 10-13 Hz. Their frequency tends to repeat that of the conditioning stimulation around 11 Hz (Fig. 3). Above 15 stimuli per second they tend to be irregular and smaller. In other preparations of the same species (Bullock et al. 1990) stable and consistent oscillations lay between 5-7 or 17-25 Hz. Some slower induced rhythms with greater amplitude are seen occasionally after the OSP response, last several seconds, and continue even after the beginning of the next train. They are not time-locked and therefore disappear in averages.
|
|
Discussion |
|
|
|---|
The principal finding is that responses in the ray's brain to repetitive visual stimuli cannot be understood simply in terms of refractoriness and recovery. Processes designated by their outcome as facilitation, suppression, rebound, induced rhythms are some of the most obvious additional factors. They may have rates of onset and decay not only different from each other but distinct for the earlier and later components of the response. We suspect the same is true widely in the brain and that models involving only fixed increments of excitation and inhibition are seriously unrealistic.
The simplest consequence of stimulus repetition is "rate decrement," the reduced response when stimulus rates are too high for complete recovery; it is commonly regarded as a result of incomplete recovery, fatigue or partial refractoriness. We find instead that one or more additional factors must be invoked. One is uncovered by the device of omitting a stimulus or terminating a train. It becomes obvious that each stimulus has had the effect of preventing a large response, which is ready to appear, like a postinhibitory rebound, quite on schedule, whenever a stimulus is missing. Withholding that inhibition by omitting a stimulus releases the suppressed components, early and late, each to its characteristic extent, resulting in an OSP.
Confirming and extending our first reports on the OSP rccorded directly from the brain, at forebrain, brainstem and lower levels, in nonmammals, we find this in a limited range of repetition rates. The range of rates was entirely above that previously explored in mammals. Also unexpected were the minimal result of blurring the expectation by jitter of the ISIs, and the early origin - in tectum and even in the retina. Besides further quantifying most of these features, especially the changes in the VEP during the transition to an SSR at different repetition rates, including local properties such as tuning to a maximum power at certain rates, an important new finding is that only a few cycles of repetition are required. Another property not previously studied is the high relative importance of the last ISI, or the last few hundred milliseconds, before an omission or the end of a train; this is consistent with the very few stimuli or short trains that suffice to cause the characteristic OSP for that ISI. Also novel are the findings of robust alternation of SSR amplitudes with characteristic ratios in defined ranges of ISIs and robust effects of extra stimuli injected at various moments in the regular stimulus cycle.. Another is the strong tendency over a wide range of conditioning ISIs toward a constant latency of the first main OSP peak after the due-time of the missing stimulus. This feature produces a temporally specific apparent expectation, so-called because we do not wish to imply (or deny) conscious awareness in the system that acts as though expecting a stimulus on time to within a few milliseconds. The OSP previously known, from humans and cats, was only in the ISI range >600 ms, and the constant latency over a wide range of conditioning rates could not be appreciated with the low range of rates and the slow, gently rounded peak, usually later than 500 ms. The other characteristics mentioned also remained unknown until the new study of human scalp OSPs (Bullock et al. 1994).
Based partly on the finding that much of the dynamics of the OSP is found already in the retina, even after the optic nerve is cut, we interpreted the OSP of our sample of fish and reptiles to mean that a particular equilibrium of inhibition and excitation is achieved during the conditioning train. What we call inhibition may simply be an intracellular depression or self-inhibition, if it is in the receptor or in a later neuron that does not receive inhibitory synaptic input. It may act upon the excitatory process stimulated in parallel in the same cell, as is well known in photoreceptors of Limulus, the siphons of pelecypods and elsewhere. The inhibitory process begins very promptly and throttles the early part of the VEP, declining with time. The equilibrium which is specific to the ISI, according to this hypothesis, automatically makes the latency of onset of the excitatory process just barely longer than the last ISI so that if the inhibition contributed by each stimulus is missing, or delayed by as little as 5-7 ms, an after-discharge process equivalent to a stimulus proceeds unhindered to show its characteristic latent period for firing the OSP. The rebound can be complex, with early brief and later slower phases and a facultative, late, induced oscillation for several hundred milliseconds. The new findings are consistent with this qualitative model.
It is already clear, based on new experiments on human subjects (Bullock et al. 1994), that the OSPs in the present study of elasmobranchs at conditioning stimulus rates >2 Hz are quite different from those previously reported in humans at stimulus rates <1.5 Hz. The new study on humans demonstrates two classes of OSPs; one is a confirmation of the previously reported, low frequency OSP (references cited in the paper just mentioned), the other is a high frequency OSP corresponding well with that we have described in elasmobranchs, teleosts and reptiles. It remains to be learned whether they arise already in the retina, as they do in the fish and reptile, but that seems most likely. Auditory or other modalities are also likely to show an early origin of the OSP, e.g. in brainstem nuclei, judging from our study of electroreception in rays (Bullock et al. 1993). Low frequency OSPs might be found in rays by training them -giving the omissions some value to the animal, by using positive or negative reinforcement.
Another indication of multiple processes, separately time-varying after each stimulus, is the alternation between larger and smaller responses (1 every 2) in a certain range of ISI, 1 every 3 and 1 every 4 in other ranges. We suggest that the present preparation is only unusual in its stability, that the complex dynamics involved are perhaps more general. Stability does not extend up to the fusion frequency but instead, in a range between the UFF (ca. 13 Hz in the thornback) and the LFF ( >30 Hz) responses sputter, some large VEPs being scattered among irregular small waves (Bullock et al. 1991).
Extra stimuli inserted either between regular members of a train or after the end of the train, at different times, are shown to be another way to demonstrate critical times to within 5 ms, by the discontinuities of response representing abrupt transitions from apparent refractoriness to facilitation.
We conclude that a major category of sensory response characteristics, besides the classical ones (sensitivity, receptive fields, recovery times and the like), is that of dependence upon recent history of iterative events, including intervals, delays, omissions and perhaps multiple facilitating and forgetting time constants. This study has examined parametrically only some variables of recent history. The findings emphasize how much descriptive phenomenology there is, even for this limited set of variables, so that further details of such dynamic characteristics with iterative stimulation will be important for understanding afferent systems at each level and in each major taxon.
|
|
References/Acknowledgements |
|
|
|---|
Bullock, T.H. Physiology of the tectum mesencephali in elasmobranchs. In: H. Vanegas (Ed.), Comparative Neurology of the Optic Tectum. Plenum Press, New York, 1984: 47-68.
Bullock, T.H., Hofmann, M.H., Nahm, F.K., New, J.G. and Prechtl, J.C. Event-related potentials in the retina and optic tectum of fish. J. Neurophysiol., 1990, 64: 903-914.
Bullock, T.H., Hofmann, M.H., New, J.G. and Nahm, F.K. Dynamic properties of visual evoked potentials in the tectum of cartilaginous and bony fishes, with neuroethological implications. J. Exp. Zool. Suppl., 1991, 5: 142-155.
Bullock, T.H., Karamürsel, S. and Hofmann, M.H. Interval-specific event related potentials to omitted stimuli in the electrosensory pathway in elasmobranchs: an elementary form of expectation. J. Comp. Physiol. A, 1993, 172: 501-510.
Bullock, T.H., Karamürsel, S., Achimowicz, J.Z., McClune, M.C., Baar-Eroglu, C. and Baar, E. Dynamic properties of human visual evoked and omitted stimulus potentials. 1994, submitted together with this paper.
Feng, A.S., Hall, J.C., and Gooler, D.M. Neural basis of sound pattern recognition in anurans. Prog. Neurobiol., 1990, 34: 313-329.
Grossberg, S. Neural pattern discrimination. J. Theor. Biol., 1970, 27: 291-337.
Makeig, S. and Galambos, R. The CERP: event-related perturbations in steady-state responses. In: E. Baar and T.H. Bullock (Eds.), Brain Dynamics: Progress and Perspectives. Springer-Verlag, Berlin, 1989: 375-400.
Perkel, D.H. and Bullock, T.H. Neural coding. Neurosci. Res. Program Bull., 1968, 6: 221-348.
Platt, C.J., Bullock, T.H., Czéh, G., Kovaevi, N., Konjevi, Dj. and Gojkovi, M. Comparison of electroreceptor, mechanoreceptor and optic evoked potentials in the brain of some rays and sharks. J. Comp. Physiol. A, 1974, 95: 323-355.
Prechtl, J.C. and Bullock, T.H. Event related potentials to omitted visual stimuli in a reptile, 1994, submitted with this manuscript.
Rao, K.P., Babu, K.S., Ishiko, N. and Bullock, T.H. Effectiveness of temporal pattern in the input to a ganglion: inhibition in the cardiac ganglion of spiny lobsters. J. Neurobiol., 1969, 2: 233-245.
Ripley, S.H. and Wiersma, C.A.G. The effect of spaced stimulation of excitatory and inhibitory axons of the crayfish. Physiol. Comp. et Oecol., 1953, 3: 1-17.
Schreiner, C.E. and Langner, G. Coding of temoral patterns in the central auditory nervous system. In: G.M. Edelman, W.E. Gall and W.M. Cowan (Eds.), Auditory Function. John Wiley & Sons, Inc., New York, 1988: 337-361.
Wiersma, C.A.G. and Adams, R.T. The influence of nerve impulse sequence on the contractions of different crustacean muscles. Physiol. Comp. et Oecol., 1950, 2: 20-33.
|
|
|---|
1. 1 Aided by support from the Department of Physiology, Istanbul Medical Faculty, University of Istanbul, Turkey
2. 2 Aided by grants from the National Institute of Neurological Diseases and Stroke and the National Science Foundation.