Paper read at Symposium on "Oscillatory Event Related Brain Dynamics," Tecklenburg, "Münsterland", Sept. 2-6, 1993,
organized by T.Elbert, B.Lütkenhöner and C.Pantev.
Correspondence:
Theodore H. Bullock and Jerzy Z. Achimowicz
University of California, San Diego
La Jolla, CA, 92093-0201
U.S.A.
e-mail: tbullock@ucsd.edu, jachimow@kbn.gov.pl
|
|
Introduction |
Nature loves to oscillate. Ongoing oscillations of a wide range of periods are familiar in animals, for example circannual, circalunar and circadian, the so-called minute rhythms of Galambos and Makeig (1988), respiratory, cardiac, and EEG rhythms of delta, theta and alpha frequencies, ca. 40 Hz cerebral, 200 Hz cerebellar, and pacemakers of electric organ discharges in certain electric fish which run at 1000-2000 Hz, night and day. In addition many living systems - or parts of them - love to show event-related oscillation. The gamma band of frequencies is popular from invertebrates to mammals, especially for transient oscillations, such as event-related rhythms, which have recently come to prominence and have been called induced rhythms in a recent book of that title (Baar and Bullock 1992).
The purpose of this paper is to shed some perspective on the topic of the symposium by surveying the literature for examples of event-related oscillations, particularly those in the gamma band. I ask, for each example, four kinds of questions. (i) Are the events with which they are related similar? (ii) Are they suggestive of a common meaning, or (iii) of a common mechanism. (iv) Are the dynamics of the oscillation basically common or diverse?
Actually, there are so many examples in the literature that I have had to make a selection. The bottom line is that the examples known do not fall into a single or a few clear categories, and do not appear to have a common mechanism or meaning. I conclude that anytime we think of a candidate hypothesis for the function or mechanism of induced rhythms, it would be wise to look around for cases that might test the hypothesis or at least its generality. If a rhythm correlates with something, for example a behavior or some aspect of the stimulus, in some species or preparation, there are at least two kinds of pitfalls to drawing conclusions. First, there may be counter examples, easily overlooked. Second, other aspects of the stimulus or response may be the significant correlates. It is not very safe to propose a certain aspect of the behavior, e.g. its cognitive aspect, is the relevant correlate, or to propose a causal relation, especially the polarity - which event is necessary for the other. However, I am personally thankful that some of our colleagues are courageous enough to make the proposals, since they, more than the physiological facts, have attracted the great interest to these oscillations.
First, then, let me define some terms. An oscillation is a rhythm or fairly regular fluctuation in some measure of activity. That means it is not simply a portion of broadband activity isolated by a bandpass filter or caused by the ringing of a filter by a transient. Filtered waves may of course be a true oscillation but if, for example, a power spectrum reveals a broad elevation, such as 25-50 Hz, it should be called merely a "gamma band component of the power spectrum," not a rhythm. Imagine hitting all notes on the piano over a whole octave! It is, in fact, quite difficult to establish that a true rhythm exists, in the presence of considerable wideband activity, unless there is a clear and narrow power peak in the wideband spectrum.
Cole (1957) and Enright (1965, 1989) have reminded us, in historically important papers, of several pitfalls in "finding" spurious rhythms. Thus caution is important in making statements and models about attributing functions to presumed gamma oscillations.
Besides the definition and validation of a rhythm, we should, for the purposes of this book distinguish (i) ongoing, background gamma-band activity from (ii) induced and from (iii) driven activity. Because we are concerned, by our title, mainly with event-related oscillations, we are mainly talking about induced rhythms. These are defined as oscillations caused or modulated by stimuli, by events or by changes in brain state that do not directly drive successive cycles (Bullock 1992).
Some authors have made a distinction between evoked and induced rhythms or activity. Consistent with the definitions and historical introduction in the recent volume on "Induced Rhythms in the Brain" (Baar and Bullock 1992), the distinction recommended is the following. Induced rhythms form the broader category; of which evoked rhythms are a subset. The term induced rhythms was introduced to call attention to a large variety of oscillatory responses that follow either clearly timed stimuli or less sharply timed state changes such as attention, sleep, expectations and seizures. Induced rhythms may be tightly or loosely time- and/or phase-locked to the triggering event and hence may appear in averaged responses or only in single trials. Evoked rhythms are the subset following clearly timed stimuli or events; they may also be more or less tightly time-locked and survive averaging well or poorly. The term evoked is generally not used for responses to less sharply timed state changes or events, such as those just named. It is used for responses that are either rhythmic or, more commonly, episodic such as one or more peaks of different duration. Nonrhythmic, episodic peaks or bumps are not generally called induced except as a common word like elicited or caused. The terms evoked and induced thus overlap. It is wise to add adjectives when some feature is important, such as "phase-locked" or "nonphase-locked," "averaged" or "not averaged," rather than to set up still more jargon by arbitrary distinctions not widely understood.
Finally, the definition of gamma band I use is 25-50 Hz, more or less, for mammals, or 15-35 Hz for exothermic species, such as insects, fish and turtles, at 15-22°C but the numerical value of the limits of the gamma band are not rigorously circumscribed.
|
|
Selected Exmaples From Nonmammalian Species and Mammalian Subcortical Levels |
|
|
|---|
Isolated axons vary widely; some respond to a pulse or step stimulus with no oscillation, others with a few damped cycles, others with rhythmic discharge on the crests of subthreshold, local oscillations lasting up to dozens of cycles. Each is a characteristic of that type of fiber (Arvanitaki et al. 1936, Arvanitaki 1938, 1939a,b, Hodgkin 1948, Wright and Adelman 1954, Tasaki and Terakawa 1982). The frequency can be up to >100 Hz. Isolated muscle fibers and other types of cells (e.g. egg cells, endocrine glands) also show rhythmic fluctuations related to impinging events.
Sense organs of various modalities show oscillations induced by adequate stimuli. Especially interesting are the electroreceptors that "ring" at the characteristic or best frequency for sensitivity, whether as a result of their sharp tuning or part of the mechanism of being tuned, we don't know. The oscillations of the stretch receptors of crayfish have been particularly well analyzed (Erxleben 1989, Morris 1990) to the level of patch clamp data on single channel openings and closings.
Retinas have labile oscillations with changes in illumination. Fröhlich (1913) described 30-90 Hz rhythms in the isolated octopus eye after ON and 20-45 Hz waves after OFF. Adrian and Matthews (1928) described a rhythmic succession of large waves, after a long latency, in whole nerve recordings from the eel (Conger), under certain conditions, especially illumination of a large part of the retina. The frequency was usually between 5-15 Hz at the low temperature of this preparation. A series of authors have added observations on other species, including mammals (Bullock 1992). From the properties and the combinations of conditions conducive to these rhythms it seems unlikely that they represent the same physiological process in these different eyes. Figure 1, although chosen to illustrate oscillations in the optic tectum, actually shows some forms of retinal rhythms, since the tectal waves follow quite closely waves recorded with semimicroelectrodes in the retina, even after the optic nerve is cut.
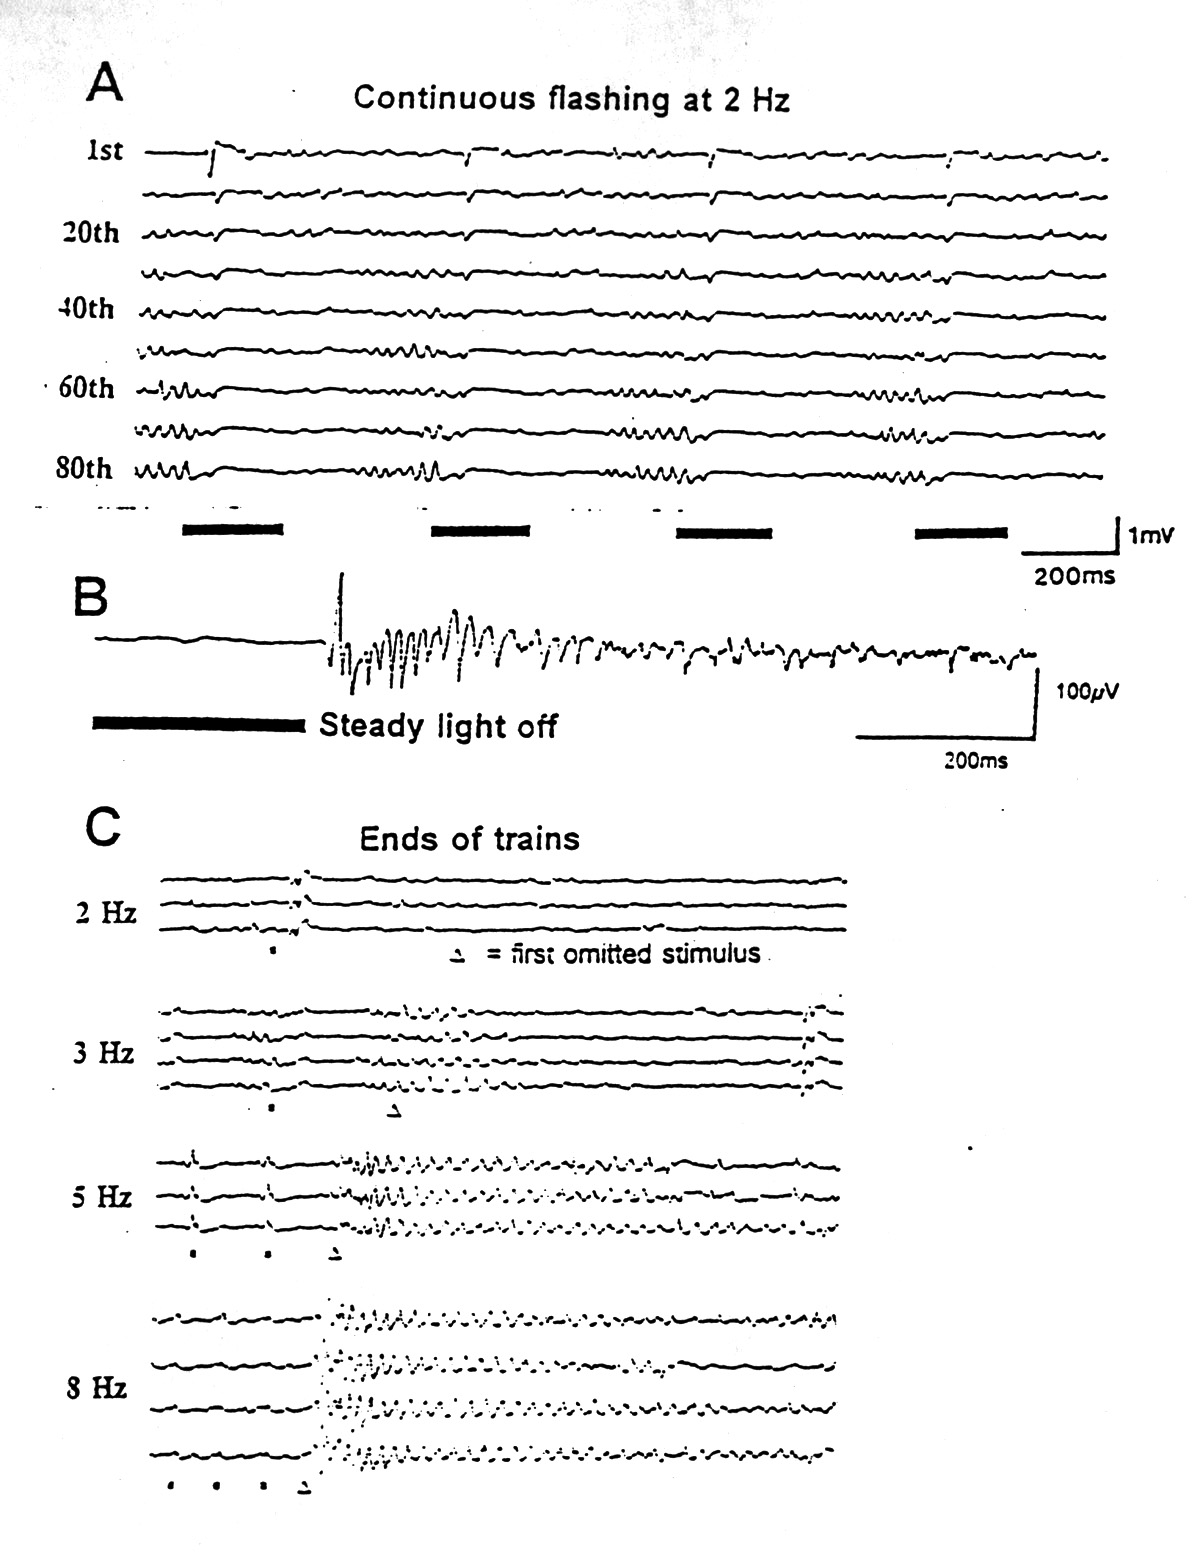 |
Figure 1. Induced rhythms with simple visual stimuli. Single sweeps recorded from the optic tectum of a ray (Platyrhinoidis) after whole-field flash stimuli (black bars). A. Continuous flashing at 2 Hz gradually induces a late oscillation following a few hundred milliseconds of suppression of EEG; the next onset of light causes a small VEP and suppression of the oscillation. B. The offset of a steady light, providing it has lasted at least 500 ms, causes a long oscillation in good preparations. The latter part of this record is normal EEG. C. The ends of 30 second trains of flashes (black squares) at different frequencies, with the due-time of the first omitted stimuli indicated by the triangles. The Omitted Stimulus Potentials include an oscillation of fixed frequency but variable duration, depending on the conditioning frequency. Most of the features seen in the midbrain can already be seen in recordings from the retina with the optic nerve cut. (Kindness of M.H. Hofmann) |
Ganglion cells like the giant neurons of Aplysia give diverse responses not only to synaptic input but to a standard event such as a depolarizing pulse; some respond rhythmically (Arvanitaki and Cardot 1941, Arvanitaki and Chalazonitis 1955, 1961). Lobster stomatogastric ganglion cells which have a spontaneous rhythm modulate that rhythm to suitable input (Ayers and Selverston 1979, Selverston 1993). This preparation has been intensively studied and illustrates how difficult it can be to decide whether a rhythm should be attributed to pacemaker cells that others follow, with modifications, or to the whole circuit or some essential subsets with particular time constants and interaction strengths.
Insect optic lobes were found quite early (Jahn & Wulff 1942, Crescitelli and Jahn 1942, Bernhard 1942) to be capable, if critical conditions are just right, including partial light adaptation, of compound field potential oscillations lasting for a second or two at 20-30 Hz, triggered by the onset of a steady light. Unit spikes tend to cluster at one phase of this 30-50 ms sine wave, riding on it rather than summating to cause it. This particular case has the special interest that it is one of a very few which show invertebrate central ganglia are capable, under special conditions, not yet understood, of slow waves like the vertebrate EEG.
Vertebrate brainstem structures, including primary sensory nuclei of the cranial nerves, reticular nuclei, and tectum, as well as the cerebellum, each have been found to employ induced rhythms upon occasion. It seems likely that this array of exemplars is not homogeneous in mechanism or meaning. The medullary nuclei for primary afferents from electroreceptors in elasmobranch fish are in the same column as lateral line mechanoreceptive and octaval nuclei. They show a labile or facultative synchronized oscillation at 5-20 Hz at 15-20C for several hundred milliseconds after a single physiological stimulus, e.g. a 10 ms current pulse of a few microvolts in the water. In the tectum of fish oscillations of 15-25 Hz (15-20C) can be seen after a single light flash or after the onset of a longer light pulse - as part of the VEP, or after the OFF, or after the end of a train of light flashes in the frequency range of 5 Hz or higher - as part of the omitted stimulus potential OSP (Fig. 1C). This echoes and modulates the OSP that we noted above already in the retina.
In neurons of the mammalian inferior olive, substantia nigra and other nuclei induced rhythms in the 10 Hz range are modulated by various impinging influences, especially calcium channel blockers (Llinás and Yarom 1986, Llinás 1988, Fujimura and Matsuda 1989).
Thalamic nuclei have repeatedly been seen to display oscillations in response to transient stimuli. One of the first reports was by Chang in 1950, who invoked the corticothalamic "reverberating circuit," popular at that time. Galambos et al. in 1952 saw repetitive or oscillatory firing in the medial geniculate; Bishop et al. in 1953 in the lateral geniculate and, skipping intervening years, Leresche et al. in 1990 in thalamocortical cells.
Hippocampal induced rhythms in the gamma band have been described after acoustic and other stimuli by Baar and coworkers (1980, Baar et al. 1992, Baar-Eroglu et al. 1992). The much studied theta rhythm or RSA of the hippocampus arises in synchronized firing of septal cells and spreads widely through the limbic and related structures (Lopes da Silva 1992) in response to certain kinds of stimuli, certain drugs or certain forms of behavior, such as walking in rats.
The olfactory bulb and associated structures are well known substrates for oscillations brought on by physiological odor stimuli (references in Bullock 1992). Even in this much studied phenomenon it is not clear whether we have to do with a single, common physiological process or whether more than one alternative or sequential mechanism may be involved in inducing the rhythms.
|
|
Selected Examples From the Cortex |
Visual cortex has been found to oscillate under steady or transient photic stimulation by many workers, going back more than 30 years (Chatrian et al. 1960, Grüsser and Grüsser-Cornehls 1962, Doty and Kimura 1963, Hughes 1964, Regan 1968, Sturr and Shansky 1971, Abdullaev et al. 1977, Whittaker and Siegfried 1983, Friedlander 1983, Pöppel and Logothetis 1986, Freeman and vanDijk 1987). I mention these studies, without reviewing them, just to remind ourselves that the elegant recent studies reported elsewhere in this volume had a premonitory background of diverse observations - and quite likely diverse phenomena. Prechtl and I (1994) have found induced rhythms to visual stimuli in the turtle cortex and dorsal ventricular ridge - to ON, OFF and omitted flashes (Fig. 2) and (Prechtl and Bullock 1993) to moving bar stimuli (Fig. 3). Once again, we are led to suppose that the event related oscillations are a widespread and heterogeneous class of responses.
 |
Figure 2. Flash induced rhythms in a reptile. A. Single sweeps recorded in the dorsal cortex of the cerebrum of a turtle (Pseudemys scripta) in the visual area at the end of a 10 s conditioning train of 20 Hz flashes. Slow components of the OSP have been filtered out to show the not strictly phase-locked 15-20 Hz oscillations. B. Average OSPs (two subsets) with wideband filter, showing that the oscillations are much attenuated in the average. (Kindness of J.C. Prechtl) |
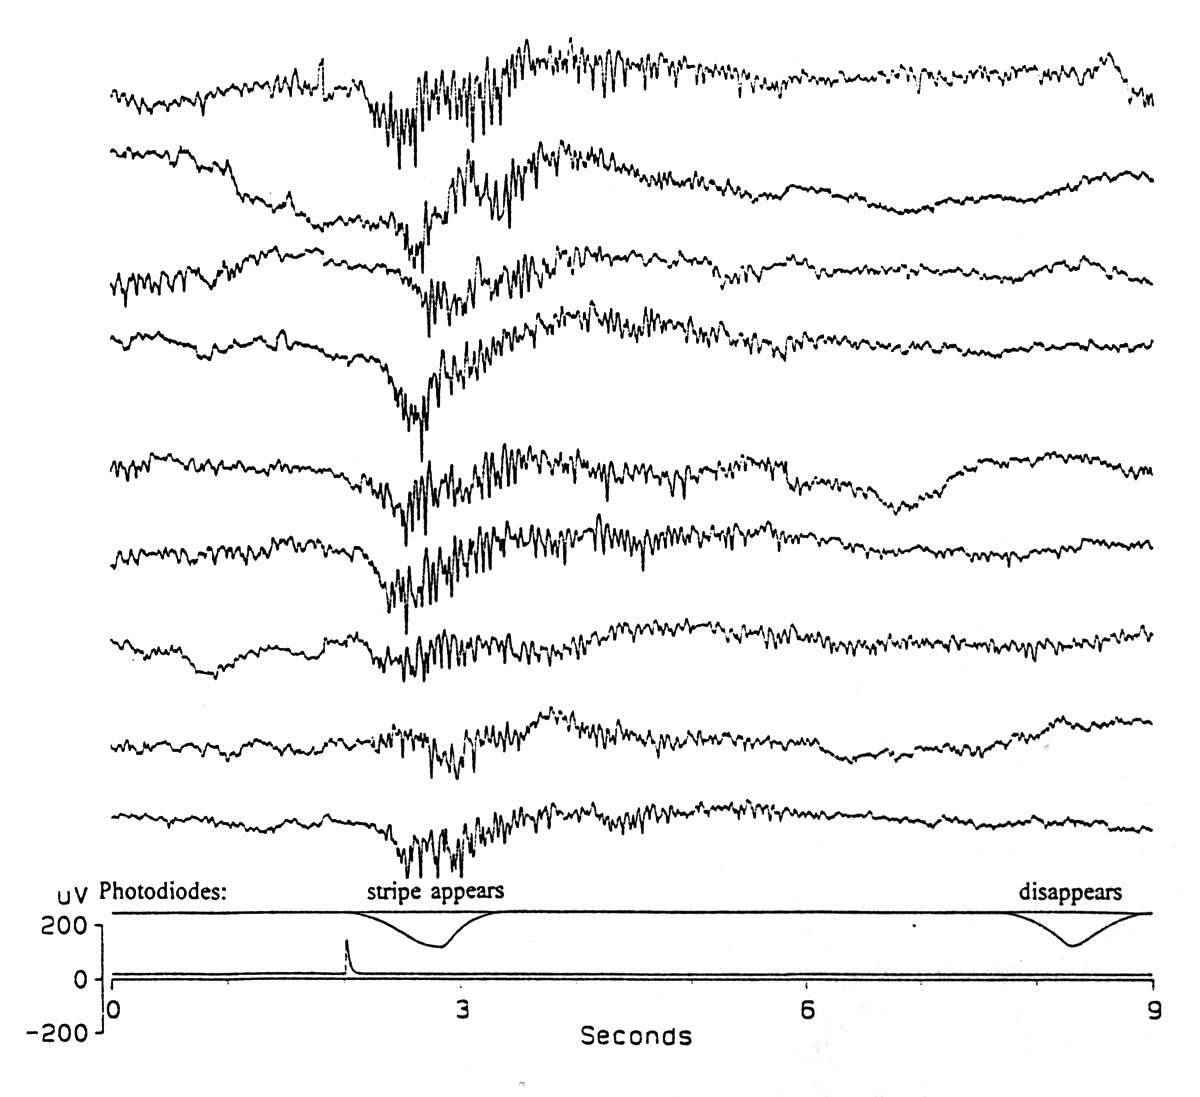 |
Figure 3. Moving bar induced rhythm in a reptile. Single sweeps recorded from the dorsal cortex of the cerebrum of a turtle (Pseudemys scripta) in the visual area, at the depth of the pyramidal cell somata during 7 s of horizontal movement (11/s) of a single 9 vertical stripe across 77 of visual field; 5 s of rest separated the sweeps. Photodiodes at each side of the screen show the appearance and disappearance of the stripe. A slow evoked negative-positive wave begins before the oscillation grows out of the background EEG. (Kindness of J.C. Prechtl) |
Cortex other than visual has also given evidence of induced rhythms under such a variety of conditions that I will mention only two. Already in 1938 Loomis, Harvey and Hobart described the "K complex" in sleeping humans following acoustic stimuli; after long latency negative and then positive swings a series of 8-14 Hz oscillations lasts for a second or more. A decade later, Bremer in 1949 showed rhythmic afterpotentials in the cat auditory cortex after a click; sometimes it could also be seen in the medial geniculate, especially in the strychninized state. Other examples are mentioned in the introduction to the book on induced rhythms edited by Baar and Bullock (1992).
|
|
Some Less Familiar Descriptors That Might Descriminate or Distinguish Between Cases |
|
|
|---|
Thus far I have offered simply a selection of literature. The following is a modest selection of suggestions for possibly heuristic, new or less familiar ways to look at data from preparations or cases of interest because they exhibit apparent oscillations that are event-related. The assumption I am making is that there is more evidence of deterministic dynamical structure, and of cooperativity available in the usual data we record than is visible by inspection of the plot of voltage against time and of the ordinary power spectrum that discards the temporal structure and assumes independence of frequencies as well as linearity.
I shall confine my remarks to the compound field potentials seen by micro- or semimicroelectrodes in or on the surface of the brain, passing over for this occasion the single unit records that see only the spike form of neuronal activity from some unknown selection of units. I shall at the same time emphasize two other things. One is the opportunity to study many loci at the same time, by multichannel recording with closely spaced electrodes that permit some insight into the spatial microstructure and cooperativity of the assembly activity - particularly by special computations that quantify degrees of congruence versus independence. Finally, I want to underline the analysis of each "sweep" or trial of event related activity, before averaging, with attention to the state of the ongoing EEG at the same locus before the defined "event."
Microstructure of coherence The first form of analysis to mention is the classical coherence - not often used, especially for intracranial recordings, and not widely familiar as to what it shows. Coherence is a linear, pairwise comparison, in that respect like cross-correlation, but it adds the feature that a number is computed for the degree of similarity for each frequency, at the resolution selected, providing a display of the fraction of the energy at each Fourier frequency component that is in phase throughout the defined epoch, without regard to which phase. Obviously, for short epochs there is a strong likelihood that the two time series, even if entirely independent, will have by chance some of the energy at each frequency in the same phase and this is called the bias; it only goes down to values <0.1 for independent time series of the usual EEG type when the epoch is longer than some seconds, but the bias is known, so that confidence levels can be calculated for any sample.
What we have found that seems not to have been appreciated before is that coherence tends strongly to be not very different for different frequencies, even for wide bands of one or two octaves or more; even from 1 to 50 Hz there is usually only a slight decline in coherence (Fig.4A). In the special cases of very strong alpha or theta band activity, both of which require special behavioral conditions, there may be a modest high of coherence at that frequency but in general the power spectrum does not predict or correlate well with the coherence spectrum, when we study subdural EEG from the cortical surface or depths and pairs of loci a few millimeters apart, rather than scalp recordings, whose peculiarities I will not deal with in this account. Under such conditions, coherence tends on average, quite reliably to fall with distance such that, from a value of 1.0 when the loci are so close together that the electrodes see virtually the same volume of tissue, it drops by a significant amount, say to 0.9 at ca. 0.5-1 mm, then monotonically to ca. 0.5 at 4-8 mm and to values insignificantly different from the chance level, say 0.1 at ca. 20-30 mm (Fig. 4B). This is almost always true in large scale averages of many pairs over many tens of seconds from all parts of the neocortex we have sampled in rats, rabbits and humans, whether awake or in slow wave sleep. The variance, however, is large and can be found to result largely from maintained local highs and lows - in short, from microstructure on the fractional centimeter scale (Fig. 5).
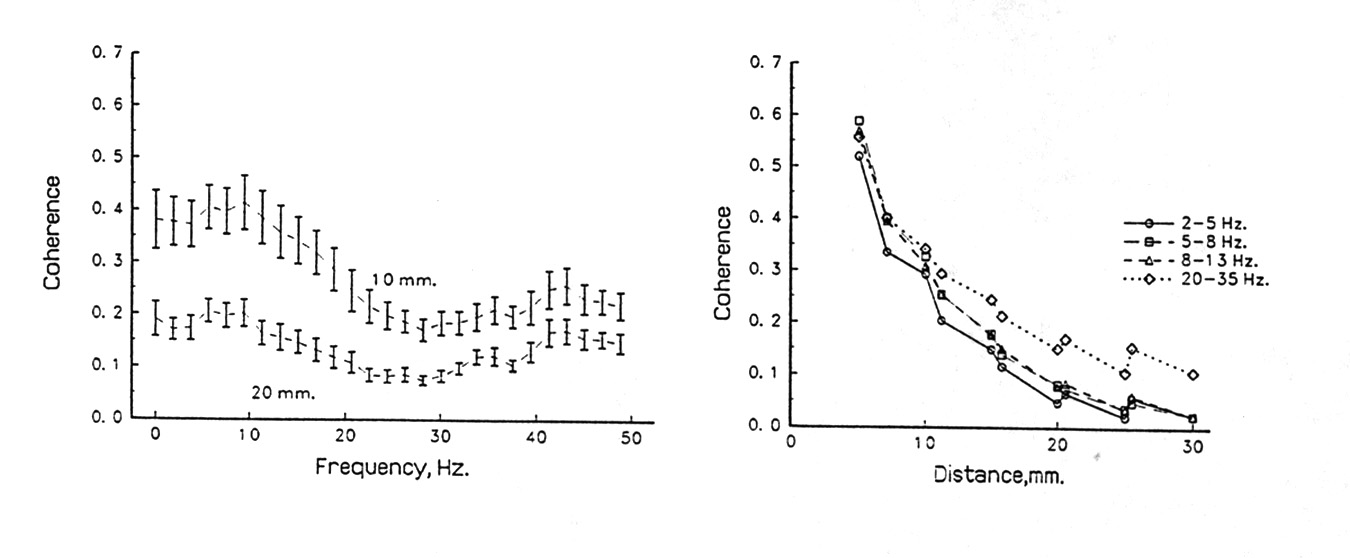 |
Figure 4. Coherence distribution in space; average decline with distance. Pairs of subdural electrodes recording human EEG; average behavior of pooled pairs of the same separation. Upper graph, coherence at different frequencies, means of many pairs 10 mm and 20 mm apart, with standard error bars, showing modest drop above 15 Hz. Lower graph, coherence as a function of separation of electrodes, for several bands; means of many pairs of the given separation (fewer pairs available at the greater distances, hence the standard errors are larger). At 5 mm coherence has already dropped to <0.6 from the near 1.0 it has to show at very small separations where electrodes see almost completely overlapping volumes of tissue; in another 5 mm it drops another half. In this case some higher bands drop less than lower frequency bands but this is not always true. |
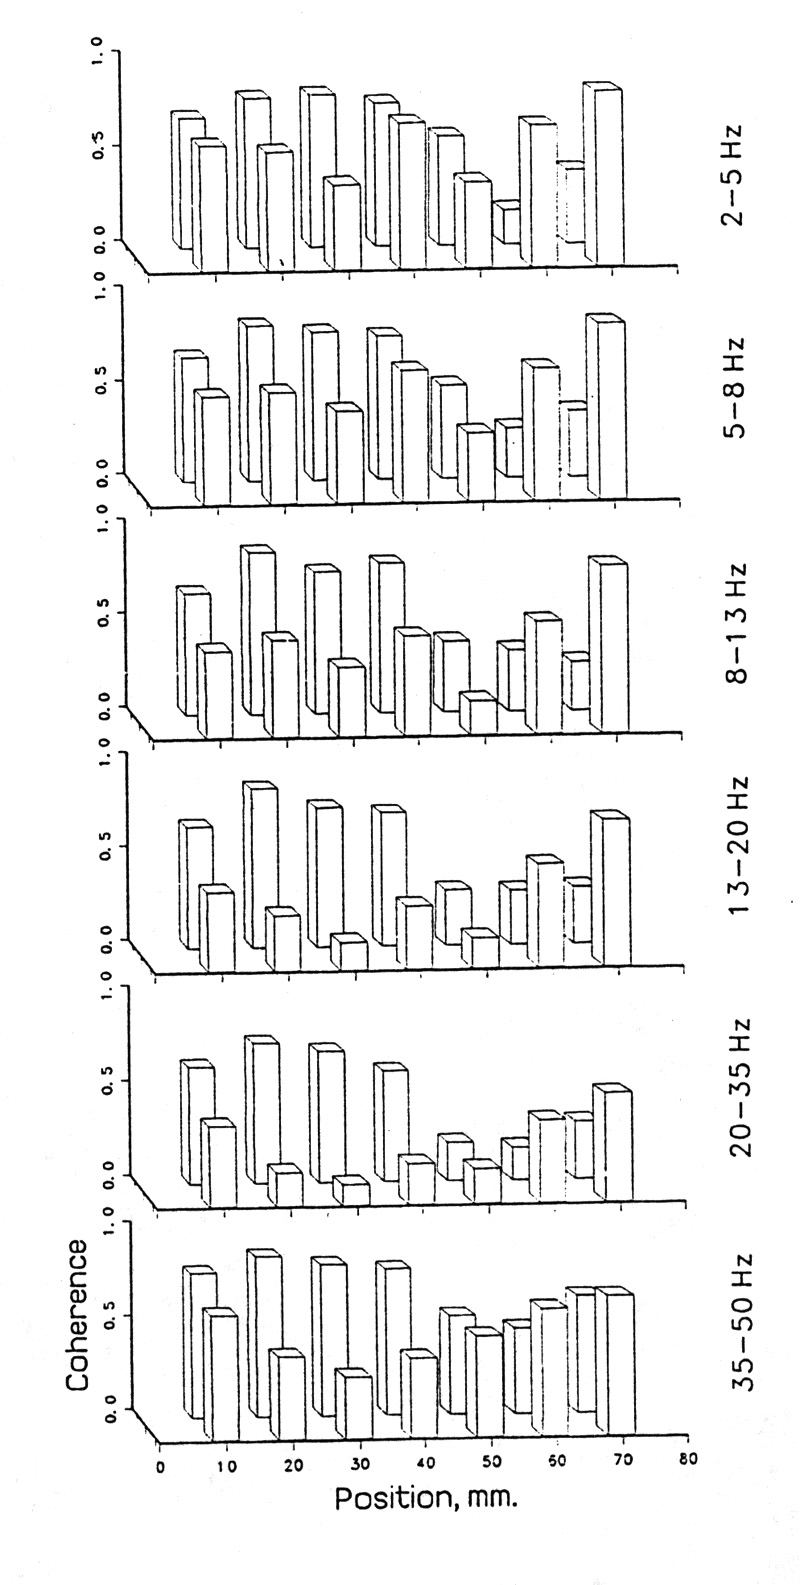 |
Figure 5. Coherence distribution in space; local differentiation. Single pairs of adjacent electrodes in 2 rows of an 8X8 array resting on the pia mater of the lateral aspect of the right inferior occipital and posterior temporal lobe of an epileptic patient, during slow wave sleep. Left to right the front row pairs are #1-2, 2-3, 3-4, ... 10 mm apart; the back row pairs are #9-10, 10-11, ... Electrode #1 is close to the tentorium, #8 is lateral, #9-16 are 20 mm superior. Bars show the mean coherence for the given band over 18 samples of 5 s each. Note that coherence can be quite local; adjoining pairs, although sharing one site, can be quite different. Note also that the profile of higher and lower values tends to repeat in different bands, that is, when coherence is high or low, this is correlated over a wide range of Fourier component frequencies. The same is often true of fluctuations over time (see Figs. 6 and 7). |
Since J.Z.A. introduced to our laboratory the autoregressive methods of analysis that permit useful short epoch calculations we have learned something new about the time trends of coherence. We had known that in short epochs variability is very high, both in successive samples and in simultaneous samples from different but adjacent pairs, even those that share one electrode, such as AB and BC. Now we can characterize them reliably, in spite of the variation. The two kinds of variability are quite distinct - spatial, simultaneous and temporal, successive sampling. The former tends to be stable over minutes at least; the latter shows a significant tendency to drift slowly up and down with preferred periods of many seconds to several tens of seconds (Figs. 6, 7).
 |
|
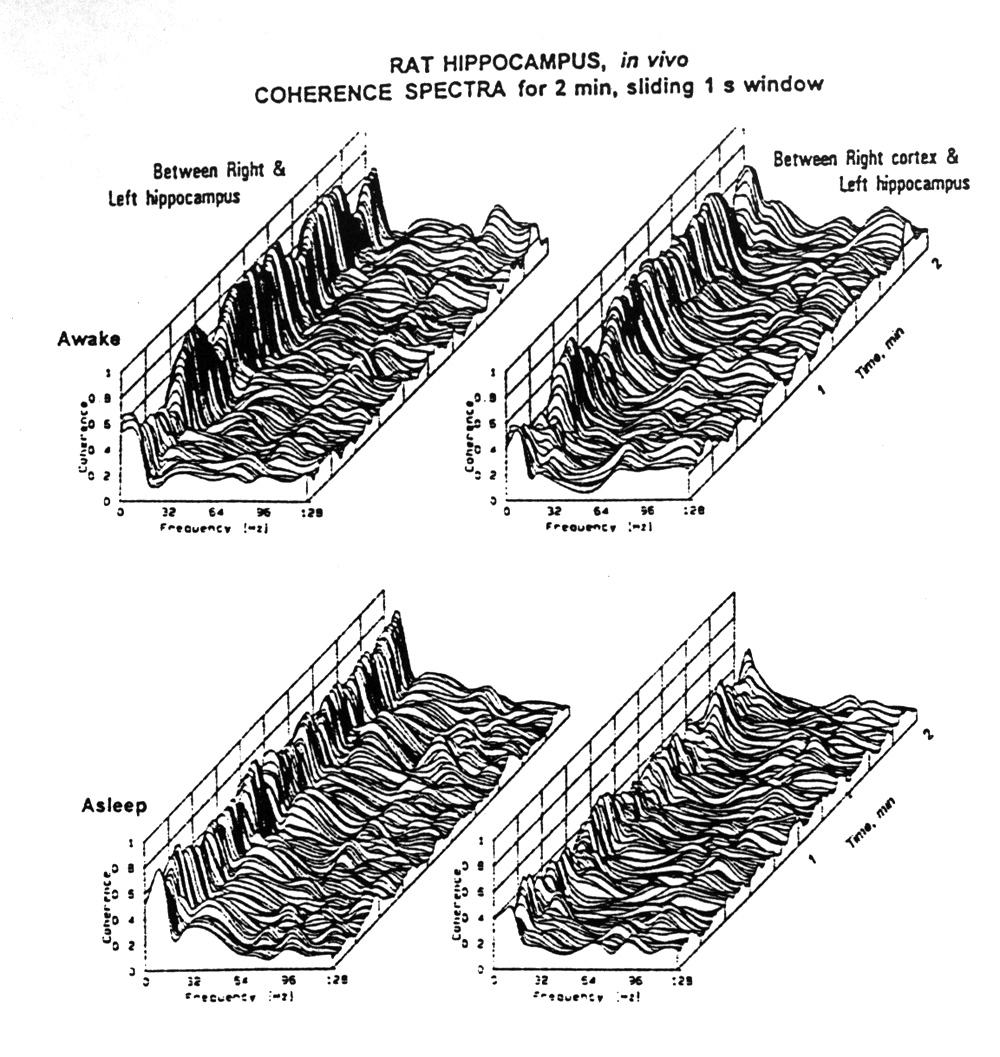 |
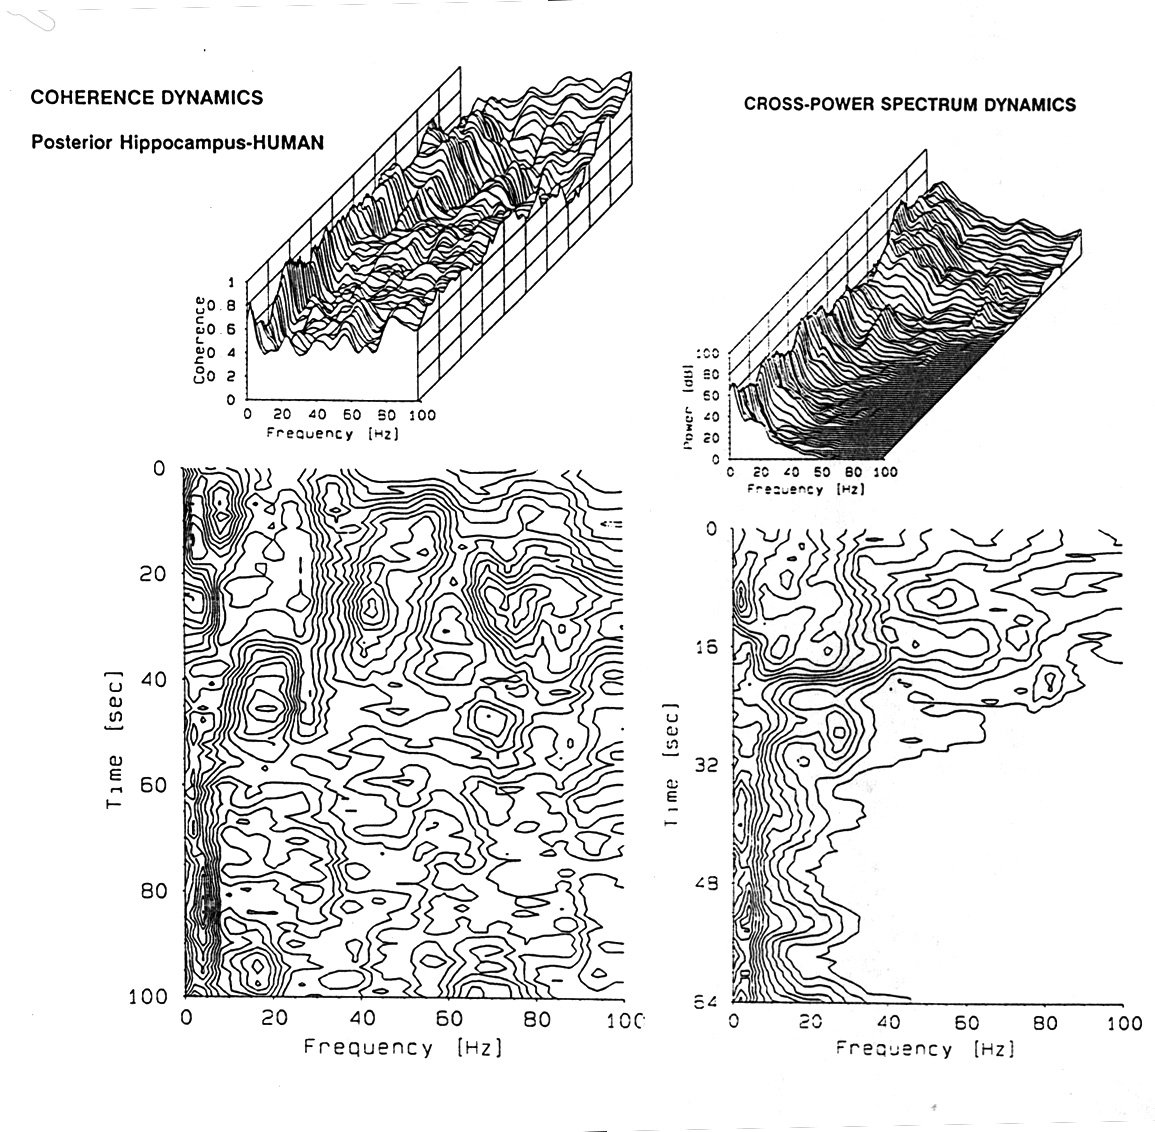
Figure 7. Coherence over time. Examples chosen from freely moving rat recordings from electrodes in right and left hippocampus and dorsal cortex, 2 min samples. (Data kindness of J.M. Gaztelu) Spectra over time are shown in 3D plots, awake and asleep, between points on the right and left hippocampus and between a point in the right cortex and a point in the left hippocampus. Sections of such plots are shown on the right for two of the bands, theta and gamma. Note that the coherence is generally higher for the left to right hippocampus, especially in the sleeping state and that the gamma band coherence is much lower at these separations than the delta-plus-theta band. Note also that coherence is typically waxing and waning with periods in the range of 2-10 s. |
The various kinds of rises and falls of coherence tend to affect all frequencies together in the 1-50 Hz range. This brief summary of the characteristics of this descriptor is enough already to suggest that the classical model of EEG as a series of independent rhythms, such as is assumed by the linear Fourier analysis can be excluded. It also suggests that there is a good deal of microstructure in the EEG, in space in the millimeter domain and in time in the domain of seconds or fractions of seconds - and that there is a lot more information in these time series, from a number of loci, than we have known about with our normal power spectral analyses. We have begun to plot coherence in the last second or two before and in the first second or two of an event-related response, for chosen bands of frequency, for single sweeps as well as averages, for many electrode pairs, close together. With sliding window displays of the time trend of coherence we can now follow the changes in this measure with a resolution of less than one second. Our experience is still too limited to report that consistent peaks of coherence appear during the ERP or which band of frequencies will be affected but we expect this approach to produce new insights.
The conclusion I draw is that we have yet to discover the main features of the EEG and ERP in respect to this measure of cooperativity, in the dimensions that matter functionally - in millimeters and seconds, in the various parts of the brain, its behavioral and pathological states and its stages of ontogeny, maturity and senility and of evolution.
Bispectrum and bicoherence The last point I will make here is that we should not stop with linear, second order measures. One example of the available, well developed methods of nonlinear analysis of third order moments is the bispectrum and its derivatives, especially bicoherence. These are much used in engineering for system identification. They are independent of the Gaussian fluctuations but quantify separately the departures from Gaussianity due to skewness around the time axis, asymmetry around the voltage axis and quadratic phase coupling between every pair of frequencies. The last mentioned, the phase coupling, is measured, normalized to the total energy at each frequency, by the bicoherence - a number between zero and one for each pair of frequencies. Much of the time the normal EEG shows no bicoherence above the chance level but episodically during normal alert periods and less often during slow wave sleep, without any obvious sign in the raw data, peaks or rugged mountains appear at some part of the plane defined by F1 and F2 - frequency pairs in the same electrode, and they may appear also in the cross-bicoherence plot between two electrodes, if they are not far apart. Our experience is still limited and applies mainly to human subdural recordings from epileptic patients, with some depth recordings from patients (Fig. 8), as well as rats and turtles. During electrical seizures the bicoherence is usually very mountainous, with many peaks and high valleys, sometimes confined to the high-high quadrant of the plot, sometimes spreading to all parts of the F1-F2 plane. Interictal periods can be quite flat or may have a small peak, usually in the low-low quadrant. We have begun to apply these methods to event related responses and find that new peaks can appear in the bicoherence plot during the ERP (Fig. 9). It is too early to make statements about consistent tendencies but the methods are sensitive to the changes in dynamical properties of the responses buried in the ongoing, event-unrelated background activity.
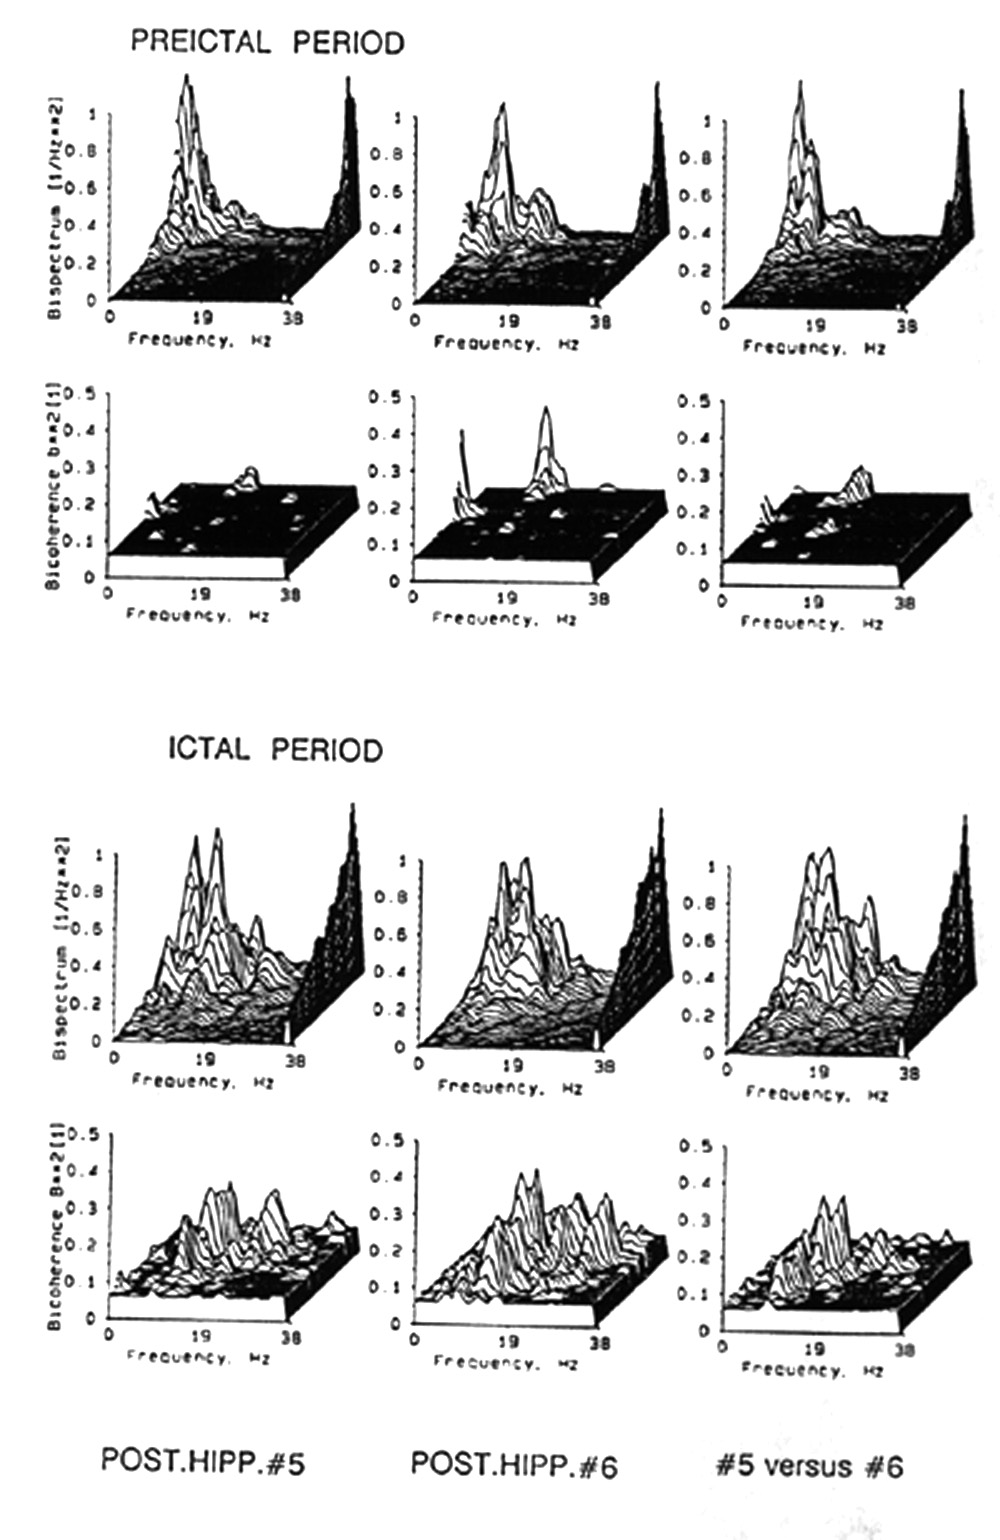 |
Figure 8. Nonlinear, nonGaussian higher moments of ongoing EEG. Bispectra (upper panels of each set) and bicoherence (lower panels of each set) of all pairs of frequencies from 1-38 Hz within each of two channels of the same data as those in Fig. 6 (left and middle columns), and between the same channels (cross-spectra, right hand column). Upper set, just before onset of an electrical seizure. Lower set, after onset of seizure. The left and middle upper panels, with auto-bispectra, also show the power spectra along the right margin; the right hand, upper panel, with cross-bispectra, also shows cross-power for the two channels. The prevailing plane of each graph is the 5% significance level; all values not exceeding that significance have been converted to this plane so that all peaks and bumps shown are at least that significant. Note that only one pair of frequencies shows preictal bicoherence, ca. 3 and 14 Hz, whereas many pairs in the range of 8-30 Hz show a substantial ictal mountain range. |
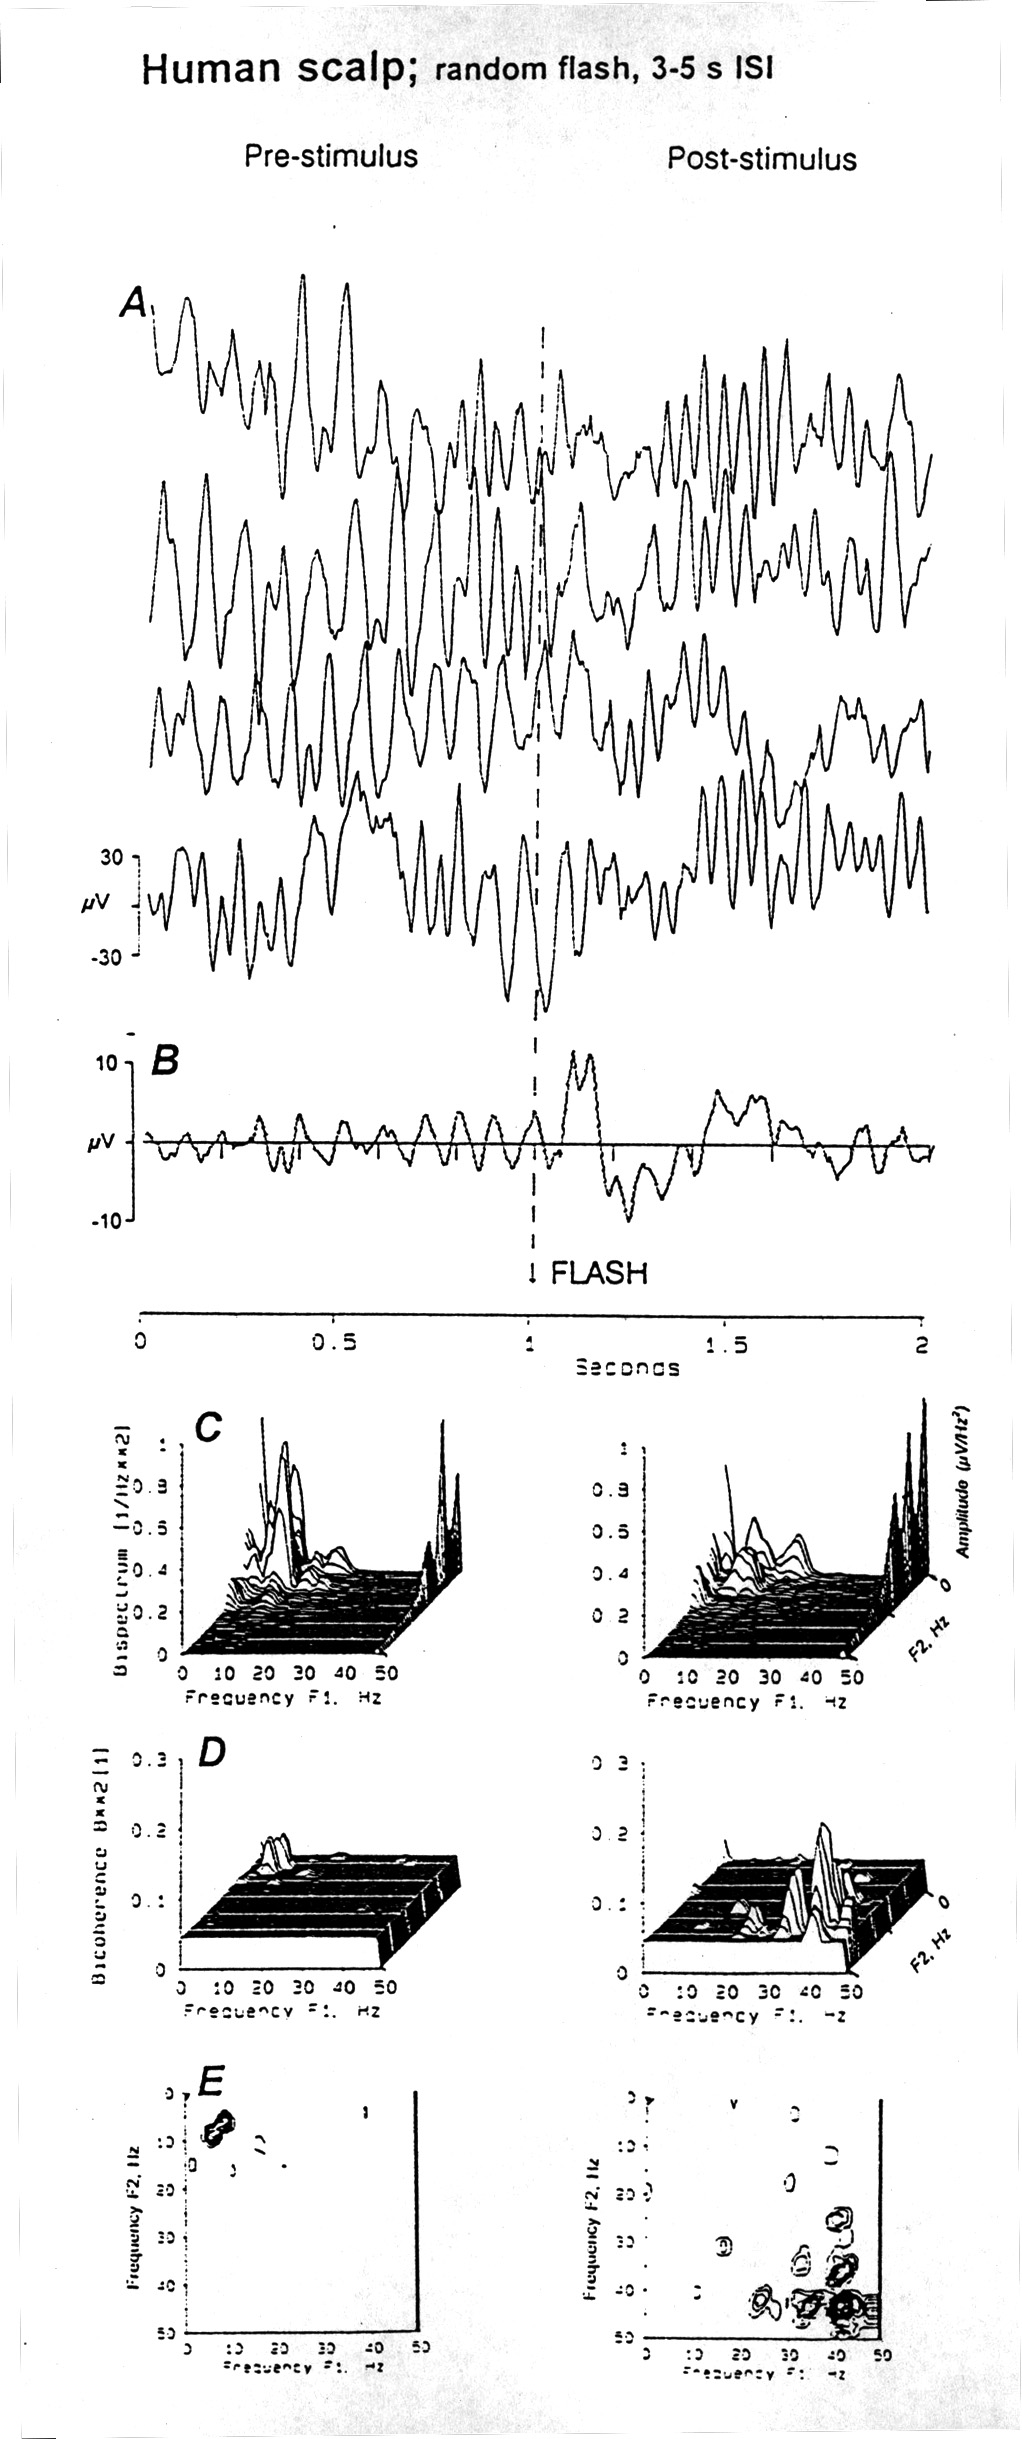 |
Figure 9. Bispectra and bicoherence of an ERP. Comparison of the 1 s epochs before and after a light flash stimulus, recorded from a parietal electrode (P4) on the human scalp, repeated every 3 to 5 s with randomly varying intervals. A. Three single sweeps as samples of the data, showing the large alpha activity in this subject. B. Average of 20 sweeps showing the VEP with P50-70, N110 and P250 waves. C. Auto-bispectrum of the frequencies in the same channel, before (left) and after (right) the stimulus. The conventional amplitude spectrum is along the right margin. D. Auto-bicoherence before the stimulus has only a small peak aty 7 and 10 Hz; after the stimulus this disappears and three new peaks appear representing quadratic phase coupling at ca. 23 and 41, 34 and.42, and 41 and 43 Hz - each shown symmetricaaly duplicated on two sides of the diagonal. E. The same in topographic form. |
We conclude that we have yet to discover the main features of the EEG and ERP in respect to this measure of cooperativity, in the dimensions that matter functionally - in millimeters and seconds, in the various parts of the brain, its behavioral and pathological states and its stages of ontogeny, maturity and senility and of evolution.
I do not doubt that still other descriptors will turn out to be useful, discriminating between places, stages and stages - if we will but widen our habits of analysis to try some of the powerful tools that approach or exceed the one second time domain and the millimeter space domain in many places at once.
ACKNOWLEDGEMENTS
This work has been supported by grants from the National Institute for Neurological Diseases and Stroke.
|
|
References |
Abdullaev, G.B., Gadzhieva, N.A., Rzaeva, N.M., Alekperova, S.A., Kambarli, E.I., Dimitrenko, A.I., and Gasanova, S.A., 1977, Oscillatory potentials in the structures of visual system, Fiziol. Zh. SSSR 12:1653-1661.
Adrian, E.D. and Matthews, R., 1928, The action of light on the eye. Part III. The interaction of retinal neurones, J. Physiol. 65:273-298.
Arvanitaki, A. 1938, "Les variations graduées de la polarisation des systèmes excitables," Thesis, Univ. Lyons, Hermann et cie, Paris.
Arvanitaki, A., 1939, Recherche sur la réponse oscillatoire locale de l'axone géant isolé de Sepia, Arch. Int. Physiol. 49:209-256.
Arvanitaki, A., 1939, Contributions à l'étude analytique de la réponse électrique oscillatoire locale de l'axone isolé de Sepia, C. R. Soc. Biol. (Paris) 131:1117-1120.
Arvanitaki, A. and Cardot, H., 1941, Réponses rhytmiques ganglionnaires, graduées en fonction de la polarisation appliquée. Lois des latences et des fréquences, C. R. Soc. Biol. (Paris) 135:1211-1216.
Arvanitaki, A. and Chalazonitis, N., 1955, Les potentiels bioélectriques endocytaires du neurone géant d'Aplysia en activité autorhytmique, C. R. Acad. Sci. (Paris) 240:349-351.
Arvanitaki, A. and Chalazonitis, N., 1961, Excitatory and inhibitory processes initiated by light and infra red radiations in single identifiable nerve cells (giant ganglion cells of Aplysia), in: "Nervous Inhibition," E. Florey, ed., Pergamon Press, Oxford.
Arvanitaki, A., Fessard, A., and Kruta, V., 1936, Mode répétitif de la réponse électrique des nerfs visceraux et étoilés chez Sepia officinalis, C. R. Soc. Biol. (Paris) 122:1203-1204.
Ayers, J.L.Jr. and Selverston, A.I., 1979, Monosynaptic entrainment of an endogenous pacemaker network: a cellular mechanism for von Holst's magnet effect, J. Comp. Physiol. 129:5-17.
Baar, E. 1980, "EEG-Brain Dynamics," Elsevier, Amsterdam.
Baar, E. and Bullock, T.H. 1992, "Induced Rhythms in the Brain," Birkhäuser, Boston.
Baar, E., Baar-Eroglu, C., Parnefjord,R., Rahn, E., and Schürmann, M., 1992, Evoked potentials: ensembles of brain induced rhythmicities in the alpha, theta and gamma ranges, in: "Induced Rhythms in the Brain," E. Baar and T.H. Bullock, eds., Birkhäuser, Boston, pp. 155-181.
Baar-Eroglu, C., Baar, E., Demiralp, T., and Schurmann, M., 1992, P300-response: possible psychophysiological correlates in delta and theta frequency channels. A review, Int. J. Psychophysiol. 13:161-179.
Bernhard, C.G., 1942, Isolation of retinal and optic ganglion response in the eye of Dytiscus, J. Neurophysiol. 5:32.
Bishop, P.O., Jeremy, D., and McLeod, J.G., 1953, Phenomenon of repetitive firing in lateral geniculate of cat, J. Neurophysiol. 16:437-447.
Bremer, F., 1949, Considérations sur l'origine et la nature des "ondes" cérébrales, Electroencephalogr. Clin. Neurophysiol. 1:177-193.
Bullock, T.H. 1992, Introduction to induced rhythms: a widespread, heterogeneous class of oscillations, in: "Induced Rhythms in the Brain," E. Baar and T.H. Bullock, eds., Birkhäuser, Boston, pp. 1-26.
Chang, H.-t., 1950, The repetitive discharges of corticothalamic reverberating circuit, J. Neurophysiol. 13:235-257.
Chatrian, G.E., Bickford, R.G., and Uihlein, A., 1960, Depth electrographic study of a fast rhythm evoked from the human calcarine region by steady illumination, Electroencephalogr. Clin. Neurophysiol. 12:167-176.
Cole, L.C., 1957, Biological clock in the unicorn, Science 125:874-876.
Crescitelli, F. and Jahn, T.L., 1942, Oscillatory electrical activity from the insect compound eye, J. Cell. Comp. Physiol. 19:47-66.
Doty, R.W. and Kimura, D.S., 1963, Oscillatory potentials in the visual system of cats and monkeys, J. Physiol. 168:205-218.
Enright, J.T., 1965, The search for rhythmicity in biological time series, J. Theor. Biol. 8:426-468.
Enright, J.T., 1989, The prallactic view, statistical testing, and circular reasoning, J. Biol. Rhythms 4:295-304.
Erxleben, C., 1989, Stretch-activated current through single ion channels in the abdominal stretch receptor organ of the crayfish, J. Gen. Physiol. 94:1071-1083.
Freeman, W.J. and van Dijk, B.W., 1987, Spatial patterns of visual cortical fast EEG during conditioned reflex in a rhesus monkey, Brain Res. 422:267-276.
Friedlander, M.J. 1983, The visual prosencephalon of teleosts, in: "Fish Neurobiology, Vol. 2: Higher Brain Areas and Functions," R.E. Davis and R.G. Northcutt, eds., Univ. of Michigan Press, Ann Arbor, pp. 91-115.
Fröhlich, F.W., 1913, Beiträge zur allgemeinen Physiologie der Sinnesorgane, Z. Sinnesphysiol. 48:28-164.
Fujimura, K. and Matsuda, Y., 1989, Autogenous oscillatory potentials in neurons of the guinea pig substantia nigra pars compacta in vitro, Neurosci. Lett. 104:53-57.
Galambos, R. and Makeig, S., 1988, Dynamic changes in steady-state responses, in: "Dynamics of Sensory and Cognitive Processing by the Brain," E. Basar, ed, Springer-Verlag, Berlin, pp. 103-122.
Galambos, R., Rose, J.E., Bromiley, R.B., and Hughes, J.R., 1952, Microelectrode studies on medial geniculate body of cat. II. Response to clicks, J. Neurophysiol. 15:359-380.
Grüsser, O.-J. and Grüsser-Cornehls, U., 1962, Periodische Aktivierungsphasen visueller Neurone nach kurzen Lichtreizen verschiedener Dauer, Pflügers Arch. 275:291-311.
Hodgkin, A.L., 1948, The local electric changes associated with repetitive action in a non-medullated axon, J. Physiol. 107:165-181.
Hughes, J.R., 1964, Responses from the visual cortex of unanesthetized monkeys, Int. Rev. Neurobiol. 7:99-152.
Jahn, T.L. and Wulff, V.J., 1942, Allocation of electrical responses from the compound eye of grasshoppers, J. Gen. Physiol. 26:75-88.
Leresche, N., Jassik-Gerschenfeld, D., Haby, M., Soltesz, I., and Crunelli, V., 1990, Pacemaker-like and other types of spontaneous membrane potential oscillations of thalamocortical cells, Neurosci. Lett. 113:72-77.
Llinás, R.R., 1988, The intrinsic electrophysiological properties of mammalian neurons: insights into central nervous system function, Science 242:1654-1664.
Llinás, R.R. and Yarom, Y., 1986, Oscillatory properties of guinea-pig inferior olivary neurones and their pharmacological modulation: an in vitro study, J. Physiol. (Lond.) 376:163-182.
Loomis, A.L., Harvey, E.N., and Hobart III, G.A., 1938, Distribution of disturbance-patterns in the human electroencephalogram, with special reference to sleep, J. Neurophysiol. 1:413-430.
Lopes da Silva, F., 1992, The rhythmic slow activity (theta) of the limbic cortex: an oscillation in search of a function, in: "Induced Rhythms in the Brain," E. Baar and T.H. Bullock, eds., Birkhäuser, Boston, pp. 83-102.
Morris, C., 1990, Mechanosensitive ion channels, J. Membr. Biol. 113:93-107.
Pöppel, E. and Logothetis, N., 1986, Neuronal oscillations in the human brain, Naturwissenschaften 73:267-268.
Prechtl, J.C. and Bullock, T.H., 1994, Event related potentials to omitted visual stimuli in a reptile, Not known
Regan, D., 1968, A high frequency mechanism which underlies visual evoked potentials, Electroencephalogr. Clin. Neurophysiol. 25:231-237.
Selverston, A.I., 1993, Modeling of neural circuits: what have we learned? Annu. Rev. Neurosci. 16:531-546.
Sturr, J.F. and Shansky, M.S., 1971, Cortical and subcortical responses to flicker in cats, Exp. Neurol. 33:279-290.
Tasaki, I. and Terakawa, S. 1982, Oscillatory miniature responses in the squid giant axon: origin of rhythmical activities in the nerve membrane, in: "Cellular Pacemakers," Vol. 1, D. Carpenter, ed., John Wiley & Sons, Inc., pp. 163-186.
Whittaker, S.G. and Siegfried, J.B., 1983, Origin of wavelets in the visual evoked potential, Electroencephalogr. Clin. Neurophysiol. 55:91-101.
Wright, E.B. and Adelman, W.J., 1954, Accommodation in three single motor axons of the crayfish claw, J. Cell. Comp. Physiol. 43:119-132.