![]() Top
Top
![]() Abstract
Abstract
![]() Introduction
Introduction
![]() Methods and Materials
Methods and Materials
![]() Results
Results
![]() Discussion
Discussion
![]() References/Acknowldgements
References/Acknowldgements
file: ospturt2.eeg rev. 12-14-93
|
|
|---|
James C. Prechtl(1) and Theodore H. Bullock(2)
Neurobiology Unit, Scripps Institution of Oceanography and
Department of Neurosciences, School of Medicine,
University of California, San Diego,
La Jolla, CA 92093-0201 U.S.A.
Running title: Reptile ERPs
Correspondence to: Theodore H. Bullock
Department of Neurosciences 0201
University of California, San Diego
9500 Gilman Dr.
La Jolla, CA 92093-0201
Ph: 619/534-3636, Fax: 619/534-3919
E-mail: tbullock@ucsd.edu
|
|
Abstract |
|
|
|---|
Visual omitted stimulus potentials (OSPs) were recorded from awake pond turtles with arrays of 3-20 electrodes in the dorsal cortex (DC), dorsal ventricular ridge (DVR) and optic tectum. Since they are generally longer in duration than the interstimulus interval (ISI), the standard experiment is a short conditioning train of regular light or dark flashes (1-20 Hz) whose termination elicits the OSP. Tectal surface OSPs after trains >7 Hz have two major positive peaks, P120-140 and P220-250 after the due-time of the first omission; after <7 Hz down to the minimum of 1.5 Hz only the slower peak appears. Some deep tectal loci also have one to three 100 ms wide negative waves peaking at variable times from 200-1300 ms. Forebrain OSPs in DC and DVR are approximately 30 ms later and often include induced 17-25 Hz oscillations, not phase-locked and attenuated in averages. Both tectal and forebrain OSP main waves tend toward a constant latency after the due-time, over a wide range of ISIs, as though the system expects a stimulus on schedule. Jitter of ISI around the mean does not greatly reduce the OSP. At all loci higher conditioning rates cause the amplitudes of the steady state response (SSR) VEPs to decline and of the OSPs to increase. Some similarities and correlations of regional amplitude fluctuations between OSPs and VEPs are noted. The OSP dynamics are consistent with the hypothesis of a postinhibitory rebound of temporally specific VEP components increasingly inhibited with higher stimulation rates; much of this response is retinal but each higher brain level further modulates. OSPs in this reptile are similar to those known in fish and to the "high frequency" type in humans, quite distinct in properties from the "low frequency" OSPs. It will be important to look at the high frequency type in laboratory mammals to determine whether they are present in the midbrain and retina, as in fish and reptiles.
Key words: brain evolution; rate decrement; sensory memory; visual evoked potential; dorsal cortex; dorsal ventricular ridge; optic tectum; visual evoked potential, VEP; ERP; missing stimuli; expectation; cognitive wave
Abbreviations: DC, dorsal cortex; DVR, dorsal ventricular ridge; ERP, event-related potential; ISI, interstimulus interval; OSP, omitted stimulus potential; SEM, standard error of the mean; SSR, steady state response; VEP, visual evoked potential.
|
|
Introduction |
|
|
|---|
Event-related brain potentials (ERPs) are a major source of information about the neurophysiological processes of cognition. In contrast to simple sensory evoked potentials (EPs), ERPs are obtained with paradigms designed to involve cognitive processes such as: expectation, discrimination, memorizing, decision making and attention in human subjects (John and Schwartz 1978; Hillyard and Kutas 1983). The oddball paradigm permits the extraction of relatively endogenous brain potential components related to the rarity or unexpectedness of a stimulus by comparing them with responses to another, frequently delivered, background stimulus. The omitted stimulus paradigm, however, is a kind of oddball manipulation which avoids the confound of sensory components by the use of a temporal expectation and a withheld stimulus. As such, the omitted stimulus potential (OSP) is the response following an omission of a stimulus after the presentation of similar stimuli at fixed intervals (a) that is not attributable to the last stimulus before the omission and (b) that is time-locked to the omission. This last specification means that the latency is, on average, constant for any given conditioning stimulus interval but does not mean that the latency is constant for different ISIs. We will report here that this is often the case.
When either of these two paradigms is used in humans with auditory or visual background stimuli, the unexpected events elicit distinctive, modality-specific negative waves between 200 and 300 ms and late positive modality-nonspecific components between 275 and 450 ms (Rogers et al. 1992; Simson et al. 1976). Few such ERP studies, however, have been conducted on nonhuman species. In mammals, experiments with omitted stimuli have been reported in the cat (Baar-Eroglu and Baar 1987; Baar-Eroglu et al. 1991a, b). Oddball stimulation has been used in the rat (Hurlbut et al. 1987; Yamaguchi et al. 1993), in the cat (Wilder et al. 1981; Buchwald 1989, 1990; Harrison et al. 1986), and monkey (Arthur and Starr 1984; Pineda et al. 1988). Pirch et al. (1985, 1986) recorded ERPs to conditioned light pulses in rats. In each of these species late components are elicited with major surface positive waves that invite speculation about homology with human P3 waves. Because the nonhuman ERPs are obtained from brains of different geometry and behavior they provide the possibility of fresh perspective for interpreting ERPs. Moreover, they permit the invasive manipulations necessary for a finer spatial or cellular analysis of ERPs.
In this laboratory similar paradigms have been used across a wide range of vertebrates to compare their responses with the brain potentials associated with cognition in humans. Because ERPs are considered to reflect cognitive processes and these may be a major domain of brain evolution, it has been a specific aim to look for ERPs in nonmammals and, if found, to compare them in dynamic properties, that is, how they change with time and temporal patterns of stimulus repetition. We have chosen to start with the omitted stimulus paradigm which simplifies the problem of distinguishing exogenous evoked components from those attributable to the aspect we call expectation in humans. With the use of regular trains of brief visual or electrosensory stimuli, OSPs have been observed in elasmobranch and teleost fish (Bullock et al. 1990; Bullock et al. 1993; Karamürsel and Bullock 1994). In the same groups as well as in reptiles (Prechtl and Bullock 1993a) the paradigms used for "oddball" and for "mismatch" stimuli in humans have been approximated and found to elicit endogenous potentials. The main difference from the oddball paradigm used frequently on human subjects is that attention is not controlled and the stimuli have no acquired significance in the fish and reptiles. With this passive paradigm a slow wave of the OSP peaking as late as 300 ms or more, like the mammalian P3, has not been observed but large, slow waves of 100-200 ms peak latency are found from the brainstem to the forebrain in these lower vertebrates. Different frequencies of the regular background stimuli have demonstrated OSPs precisely time-locked to the omitted stimulus and with a nearly constant latency from it. The system acts as though it expected the missing stimulus on schedule by a form of sensory memory but we do not imply conscious awareness. Indeed, the finding of signs of this expectancy already in the retina or first medullary sensory nucleus suggests it is not required.
In previous papers we have reported briefly on aspects of the oddball, mismatch and omitted stimulus ERPs of the turtle (Prechtl and Bullock 1990, 1992, 1993a). The present report details the structure and temporal properties of visual OSPs at different levels of the turtle visual system and compares them to visual evoked potentials (VEPs) at long and at short ISIs. The responses examined are from two parallel visual projection systems: (i) the tectofugal system that projects from the tectum to the thalamus and thence to the subcortical dorsal ventricular ridge (DVR, Fig. 1B) and (ii) the thalamocortical system that projects through the thalamus to dorsal cortex.
|
|
Materials and Methods |
|
|
|---|
Subjects
Pond turtles of both sexes were used (7 Chrysemys picta, 20 Pseudemys scripta), having carapace lengths between 16 and 17 cm. The turtles were maintained in wet-dry aquaria (20-25 C) on a 14:10 hr light/dark cycle. Use and handling of the animals were under the guidelines established by the University of California, San Diego and the National Institutes of Health.
Surgery
Surgery was performed under cold anesthesia during which core temperature of the animal was maintained at 4C by immersion in a crushed ice slush. In addition, 20% benzocaine (topical) and 2% lidocaine (subcutaneous) were used as local anesthetics. In acute experiments, head position was fixed by an aluminum frame that was cemented with dental acrylic to the maxilla and to screws anchored in the frontal bones. Micromanipulators were used to position electrode arrays. After warming to room temperature (22-24C), the head wounds were painted with 5% lidocaine ointment. For chronic electrode implants, the dura was opened and planar arrays of 13-20 electrodes were placed in contact with the pia or gradually inserted into the brain. The array was then anchored to the skull with screws and dental cement. After recovery, miniature Amphenol plugs were attached to fine, shielded, multi-conductor cables for recording without restraints (Fig. 1A).
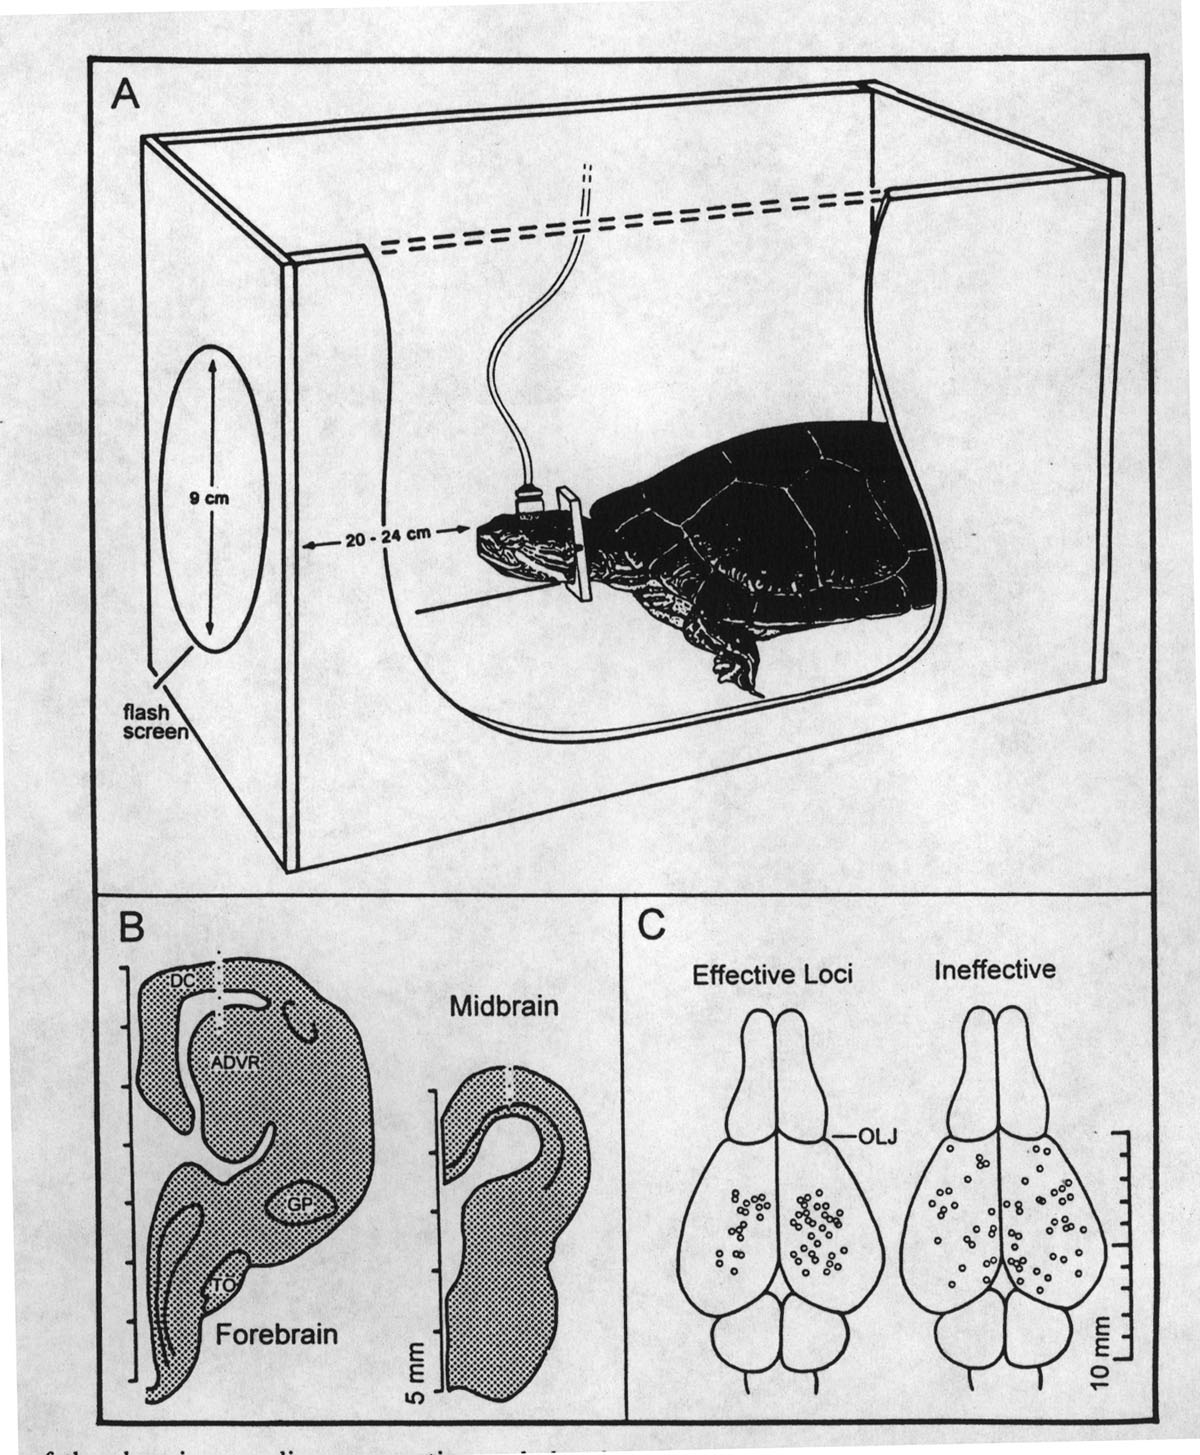 |
Fig. 1. A. Illustration of the chronic recording preparation and chamber. B. Diagram of depth array placements in the dorsal cortex (DC) and anterior dorsal ventricular ridge (ADVR) and in the midbrain tectum (TO, optic tract; GP, globus pallidus). C. Distribution of effective (left) and ineffective (right) cortical OSP recording sites. Effective sites in each of the subjects were those with OSP amplitudes 0.5 standard deviations above the mean and ineffective sites had OSPs 0.5 a standard deviation below the mean (OLJ, olfactory lobe juncture). |
Electrodes and Recording
For epipial recordings the blunt cut ends of 89 µm diameter insulated stainless steel wires were used. Sharpened tungsten or stainless steel needles (0.05-3.0 Mohms) were used for intracerebral recording individually or in quasiparallel arrays. Alternatively, axial arrays of 5-7 metal contacts on printed circuit spear-like probes with contact spacings of 150-200 µm were used (Fig. 1B; provided by the Bioelectrical Sciences Laboratory, Univ. Michigan, Ann Arbor). Brain recordings were monopolar with the reference electrode in the frontal sinus area. The electro-oculogram was recorded with stainless steel pins placed below and on the temporal side of the eye.
In initial experiments the rostro-caudal and medio-lateral zones with the largest OSPs were localized with planar epipial arrays (Fig. 1C). This zone was then sampled with the depth arrays in order to sample from all levels of the dorsal cortex and of the superficial dorsal ventricular ridge. Depth was given by the position of the pial surface on the axial array; thus if the surface is at the level of the seventh electrode, we know that each deeper electrode is 150 or 200 µm farther in, depending on the probe used. Electrode placements were localized by surface markings with depth coordinates and/or anodal iron deposits for Prussian Blue staining. The brains were sectioned at 30 µm and stained with neutral red. The atlas of Powers and Reiner (1980) was consulted.
Amplified potentials (5k gain, linear far above the observed voltages) were band passed between 0.1-50 Hz, digitized at 256 Hz with 12 bit resolution covering 500 µV and analyzed with in-house and commercial software (BrainWave Systems Inc., Broomfield, CO).
Stimuli and Protocol
The paradigm was passive; stimuli were repeated often, with no reinforcement or observable motor response. Strobe flashes (Grass PS22) 120,000-1,000,000 lux for a duration of 8 µs were presented via a fiber optic conduit positioned 1-2 cm away from the eyes, the lids of which were sealed shut with an acrylic tissue cement (Histoacryl) and covered with a diffusing lens. Ambient illumination was between 2 and 11 lux. Under these conditions the flash intensity is far below maximal and above threshold, physiologically. In the chronic experiments, the animal rested in a plastic chamber with 2 cm of water and, being free to move its head, the fixed light pipe was unsuitable, so the flash stimuli were projected onto a round white screen, the 9 cm diameter of which subtended ca. 22 of arc. In this situation gaze and whether the eyes were open or closed were not controlled. The OSP results from chronic recording experiments, more representative of normal visual behavior, did not differ substantially from those of the acute experiment.
Rather than periodically omitting a single flash in a series of regular flashes, most OSPs were recorded at the end of a conditioning train because the OSP was found to last many hundreds of milliseconds and continued stimulation mixes VEPs with the OSP. The standard test was a set of 10 s trains (1-20 Hz flashes) separated by 10 s rest periods. These alternated with bouts of "single" flashes, meaning long ISIs (>3 s) to monitor the rested VEP. The alternation of stimulus mode and the series of different conditioning flash frequencies were generated by an interleaved stimulation-acquisition program, developed with BrainWavetm software. This design reduces the possibility that trends in responsiveness might influence the comparison of ERP and EP. Averages based on 15-20 epochs, collected from each of the subjects were used for various comparisons by paired, 2-tailed t-tests (SYSTATtm software). For base-to-peak measurements the average voltage level during a 50-200 ms prestimulus period was used as the base. Onsets were the points in time where the excursion of a given wave clearly was judged to differ from the base level. Because of the ambiguities involved in determining onsets and terminations, the durations and onset latencies given in Table 1 might be less precise than those for the peaks. Standardized response latency and amplitude values (z-scores) from 5-11 electrodes per subject were used for VEP-OSP correlation analyses.
|
|
|
|
|
|
|
|
|
|
|
|
|
|
|
|
| Sample, N= |
|
|
|
|
|
|
| Onset latency, ms |
|
|
|
|
|
|
| Peak latency, ms |
|
|
|
|
|
|
| Duration, ms |
|
|
|
|
|
|
| Peak amplitude, µV |
|
|
|
|
|
|
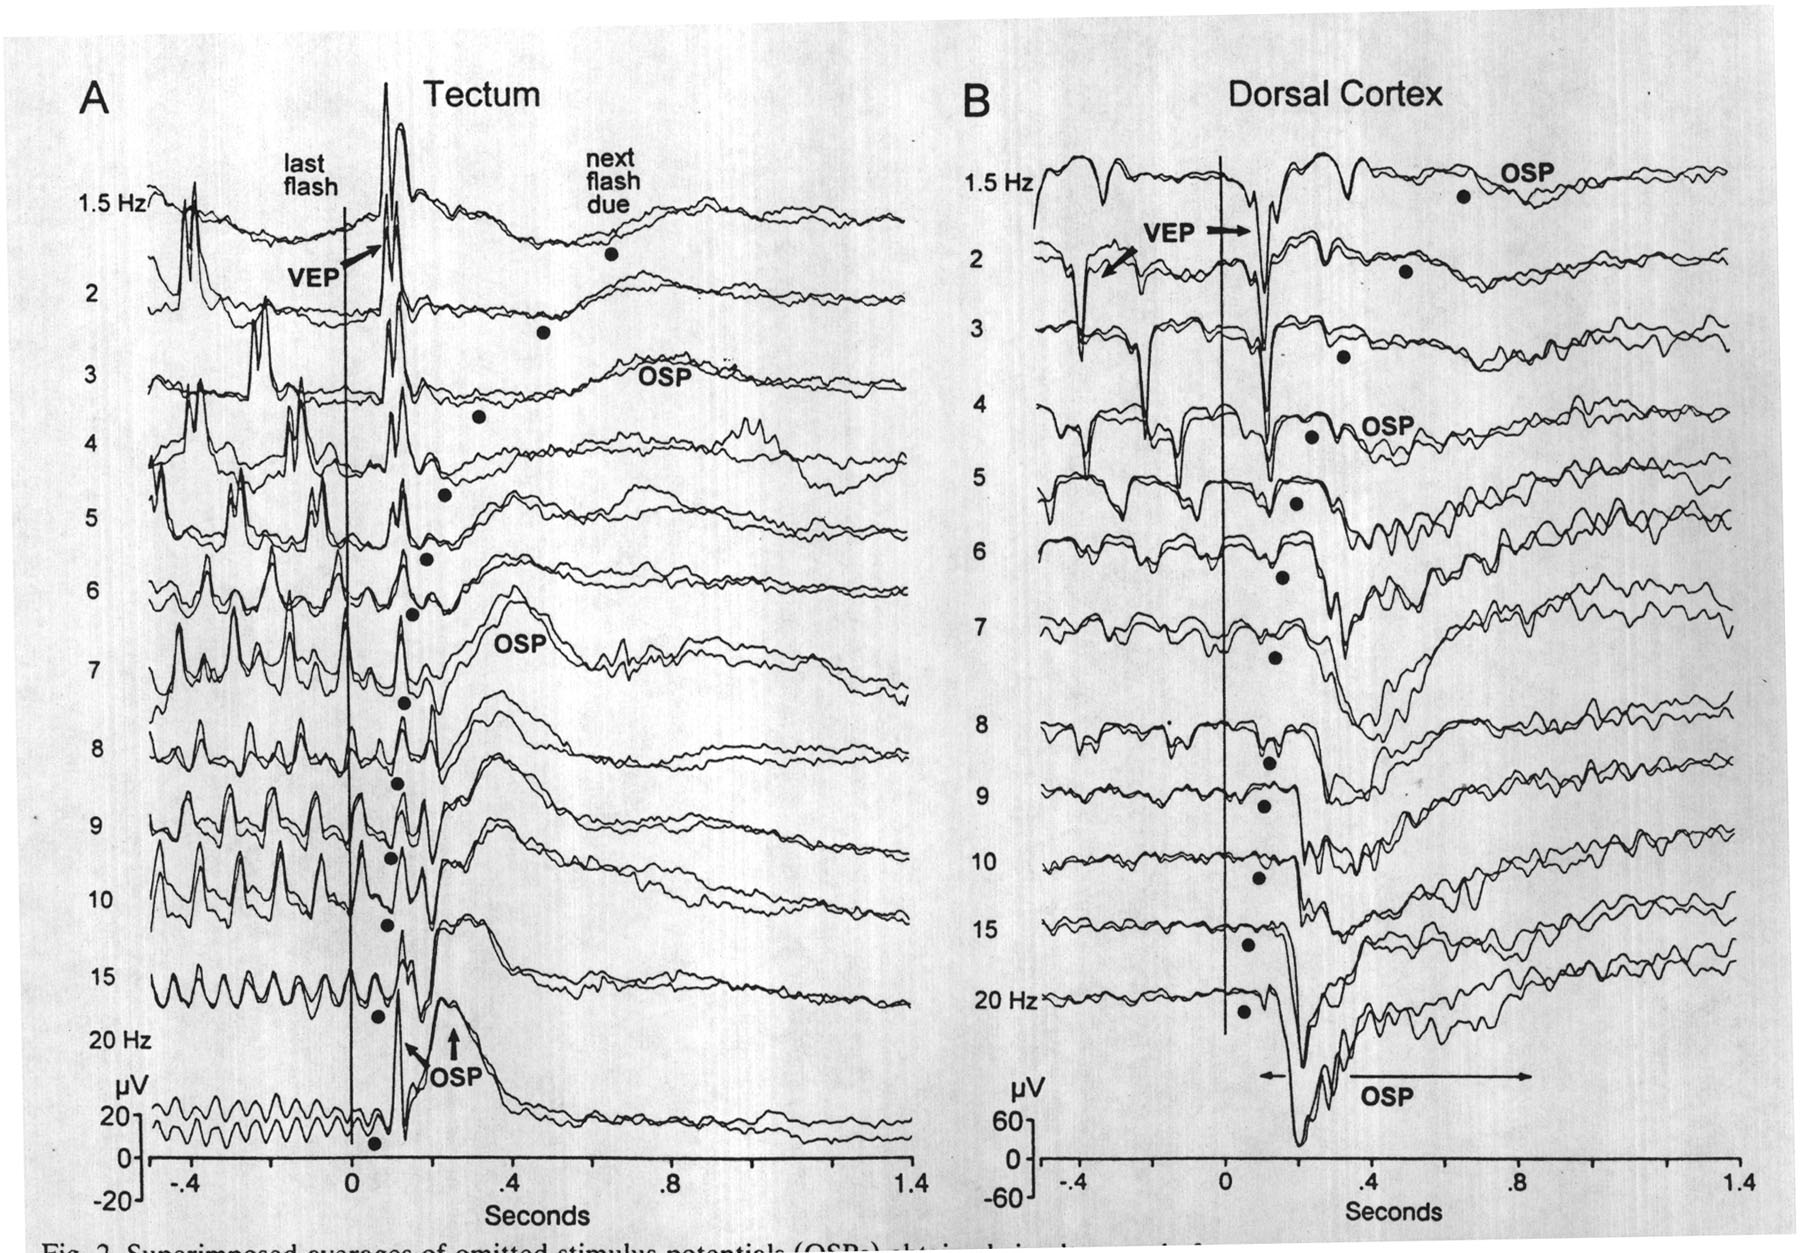 |
Fig. 2. Superimposed averages of omitted stimulus potentials (OSPs) obtained simultaneously from an epipial tectal surface electrode (panel A) and a dorsal cortical surface electrode (panel B) after different conditioning frequencies (1.5-20 Hz). A vertical line marks the last flash of the train and dots indicate the time when the next flash was due but omitted. Some of the OSPs shown are labeled. The latency of the largest positive wave tends toward a constant P230-260 after the due-time of the omitted flash (except for 3, 4, and 20 Hz). (Avgs. of 15 sweeps; band-pass 0.3-50 Hz) |
|
|
Results |
|
|
|---|
Omitted Stimulus Potentials: Tectum
The OSP is like an OFF-response but rather than being linked to the offset of the train its latency is locked to the due-time of the first omitted stimulus. This relationship is shown by the test of changing the flash frequency in the conditioning train. A near-constant latency of the first main OSP peak after the due-time is found for a range of ISIs. In Fig. 2A a vertical line marks the last flash of each train and is followed by the last VEP; farther to the right are large dots that mark the due-time of the first omitted flash.
OSPs are larger (base-to-peak) and easier to discern after trains of the higher conditioning frequencies; they are identified as the first deviation in the repeating pattern of successive VEPs, the steady state response (SSR). The average onset latency of this deviation from the due-time of the first omitted flash for 10 Hz conditioning trains is given in Table 1. OSPs to higher conditioning frequencies consist of fast, early deflections and later long-lasting ones. The principal or largest peak which occurs within 200 ms was used for the comparisons given in Table 1; it had an average peak latency of 129 ms and a positive polarity (hereafter P129) when recorded at the surface. In Fig. 2A this wave is seen as a positive deflection that ends in a plateau; it is preceded by a smaller, narrow positive peak, P70-90, at frequencies >7 Hz, and followed by a rounded P210-260. The late component is seen after all frequencies from 1.5 Hz up (except for a longer latency at 3 Hz); the P70-90 increases greatly with higher conditioning frequencies (i.e. 15 and 20 Hz). On average the early and late components of the 10 Hz tectal OSP had a combined duration of 628±71 ms. The congruence of two successive averages of 15 trials (Fig. 2A) is consistent with the observation that OSPs did not habituate or change over periods of many minutes to an hour or more. The OSPs are also observable in single sweeps.
The example of an averaged OSP given in Fig. 2A was recorded from the dorsal surface of the optic tectum. OSPs recorded from deep placements in or near the periventricular zone (indicated by electrode tip in Fig. 1B) also had two major waves, both negative, at ca. N130 ms and N200-600. Additionally, OSPs recorded from many deep loci include one or more broad negative waves (100-200 ms wide; Fig. 3) with amplitudes of 50-100 µV. These broad negative waves occur with highly variable latencies after trains and are seldom seen in the absence of such stimulus trains. Most of them appear between 125-500 ms after the omitted stimulus where they overlap with the late negative slow potential. Because they are not well time-locked to the omitted stimulus, in averaged data their presence appears as a ripple on the late slow potential. Similar broad negative waves, although smaller and less frequent, occur as components of the rested VEPs obtained from the same locus after long ISIs. They also occur at unpredictable latencies in the successive VEPs of the flash train. We repeat for clarity, that these broad negative waves are rare in the background and are confined to deep tectal loci, within or near the periventricular zone.
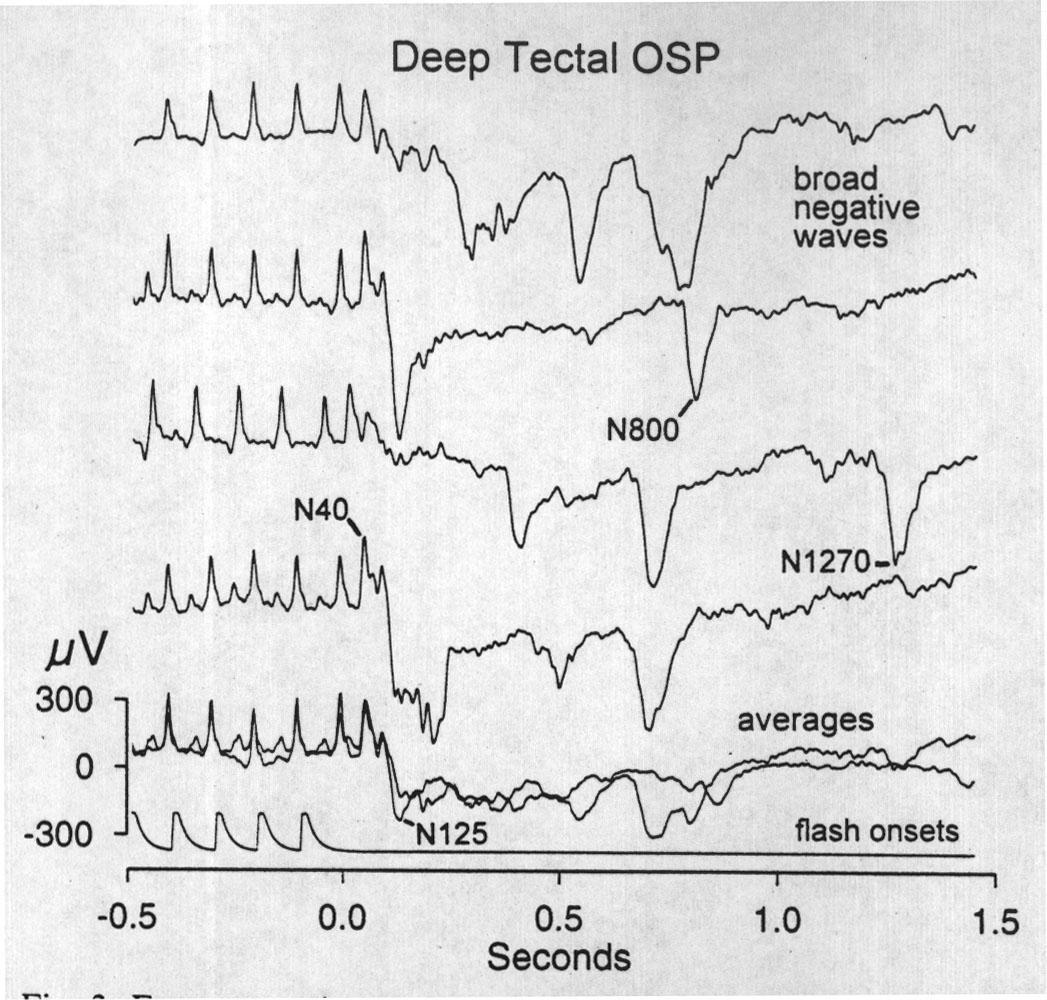 |
Fig. 3. Four successive epochs of OSPs (top traces) recorded at a deep tectal electrode locus, in or near the periventricular zone, after 10 Hz flash trains. OSPs at such loci are distinguished by broad negative waves. These waves appear at varying latencies but most often immediately after the early waves of the OSP (ca. 125 ms). Waves of this size and shape were observed sometimes after light flashes but rarely in the unstimulated EEG. Bottom traces are superimposed averages of the four epochs shown and of a subsequent four epochs. The latency jitter of most of these broad negative waves produces a rough, negative trough in the average. |
Omitted Stimulus Potentials: Forebrain
In the initial experiments (N=11) forebrain OSPs were recorded with planar arrays of epipial electrodes above the dorsal cortex. Figure 1C shows the distribution of the most effective and the least effective recording sites for the OSP. A site was arbitrarily classified as most effective if the base-to-peak (b-p) amplitude of its 10 Hz OSP was 0.5 standard deviations above the mean of all the loci in that animal, and least effective if its OSP was similarly below the mean. Electrode loci with intermediate OSPs are not shown. The distribution of effective sites corresponds generally to the forebrain visual areas delineated by prior electrophysiological mappings (Bass et al. 1983; Karamian et al. 1966). (Some of the ineffective sites that overlap this are probably due to poor electrode tip contact. The data for this suggestion are that single electrode penetrations in the center of this zone routinely yield large OSPs).
In later experiments in-line, depth arrays of 5-8 electrodes (150-200 µm spacing) were used in this visual area, that is, 1.5-3 mm lateral and 2.5-5 mm caudal to the olfactory lobe juncture (labeled OLJ in Fig. 1C). The arrays sample activity across the dorsal cortex, lateral ventricle and the dorsal ventricular ridge (DVR; illustrated in 1B). Figure 2B has the same format as 2A and shows averaged OSPs obtained with electrodes in or slightly above the pyramidal cell layer of the dorsal cortex. VEPs and OSPs obtained at this level, or superficially, have a predominantly negative polarity.
Figure 2B shows that a small but reliable wave is seen at ca. N170-200 ms after the omitted stimulus of the 1.5 Hz train. Except for the 3 Hz record all frequencies show OSPs at ca. N150-250. Similar to the tectal OSP, higher frequency trains elicit OSPs with early sharp components as well as late slow potentials. This is clearest at 10 Hz with a sharp N130 and a rounded N230 very slowly declining. In Fig. 2B, OSPs elicited with frequencies of 5 Hz and greater also include 17-23 Hz oscillations from about 0.2-1.2 s after the omission. In spite of inconstant frequency and phase, in this case they survive the averaging; they are even larger in single sweeps.
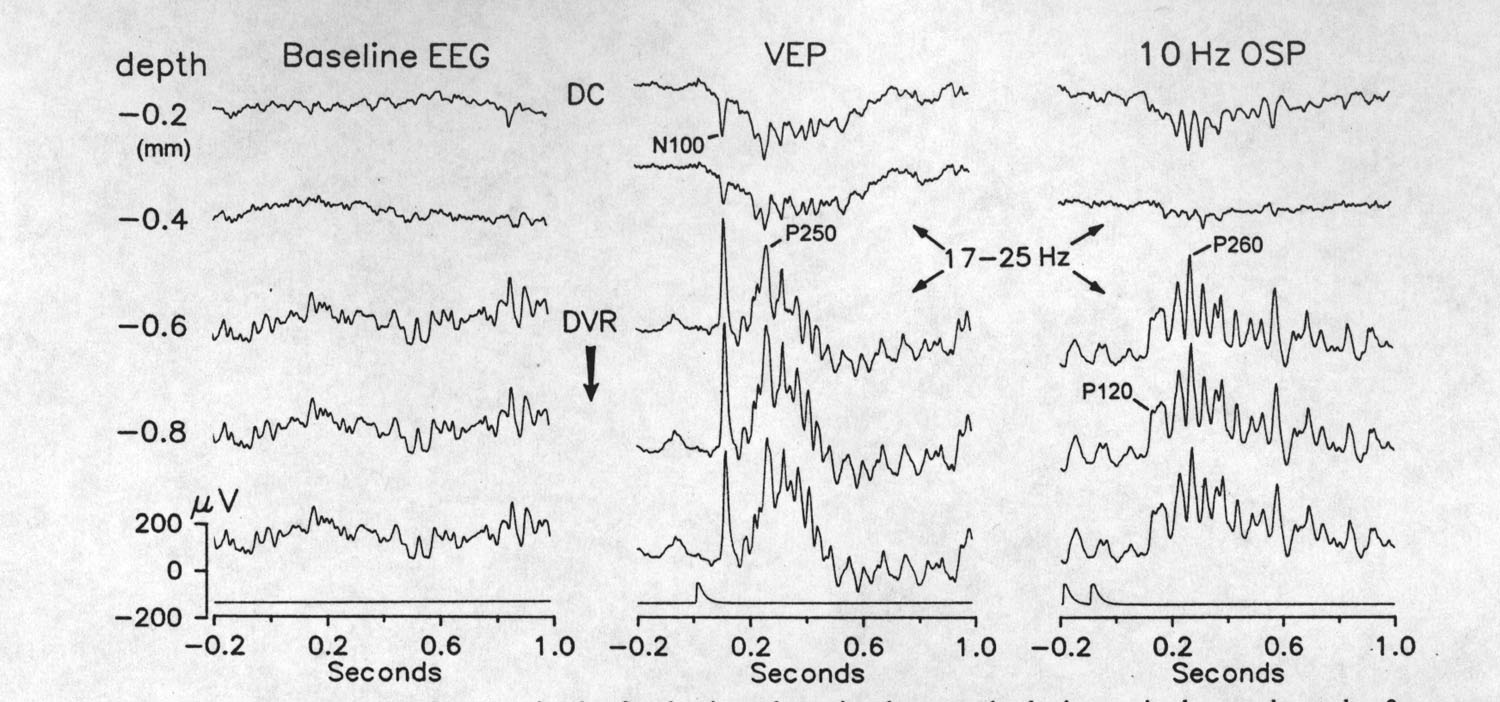 |
Fig. 4. Profiles recorded with a depth electrode array in the forebrain, taken simultaneously during a single epoch, under three response conditions: baseline (left), single flash VEP (middle) and 10 Hz OSP (right). Upper trace is the dorsal cortex (DC), the second trace is from deep DC or just below it in the ventricle, and the bottom three traces are from the dorsal ventricular ridge (DVR). DC responses are predominantly negative but otherwise similar in form to the DVR responses. The VEP and OSP both often contain ca. 20 Hz spindles, whereas, these are rare in the baseline EEG. (Presented or omitted stimuli at time zero) |
OSPs recorded with electrodes in the DVR are generally similar in form to those of the cortex at the same transverse or antero-posterior level but their polarity is positive. The right panel of Fig. 4 shows the depth profile for a single epoch 10 Hz OSP; the upper trace is cortical, the second trace is from near or in the lateral ventricle and the lower 3 traces are from the DVR. The OSP in the DVR includes oscillations (ca. 20 Hz) similar to those of the overlying cortex but with an inverted phase. Similar oscillations are seen in the single flash VEP (middle plot of Fig. 4). The background or unstimulated EEG, however, (Fig. 4 left plot) only rarely contains such spindles. These oscillations, although evoked by the omitted stimulus are not phase-locked to it and are attenuated greatly in averages. Figure 5 shows 15 successive epochs of band-passed (10-25 Hz) OSPs generated after 10 Hz flash trains. The wide-band average (i.e. 0.1-50 Hz) of these epochs and another average of 15 subsequent epochs are shown in the bottom plot. Note that the slow potential in the averages correlates with the time of the highest amplitude oscillations. There is no obvious relationship between the conditioning frequency and the frequency of OSP oscillations. The ca. 15-20 Hz oscillations of Fig. 5 followed 10 Hz trains but oscillations in similar frequencies were generated after trains of lower flash rate.
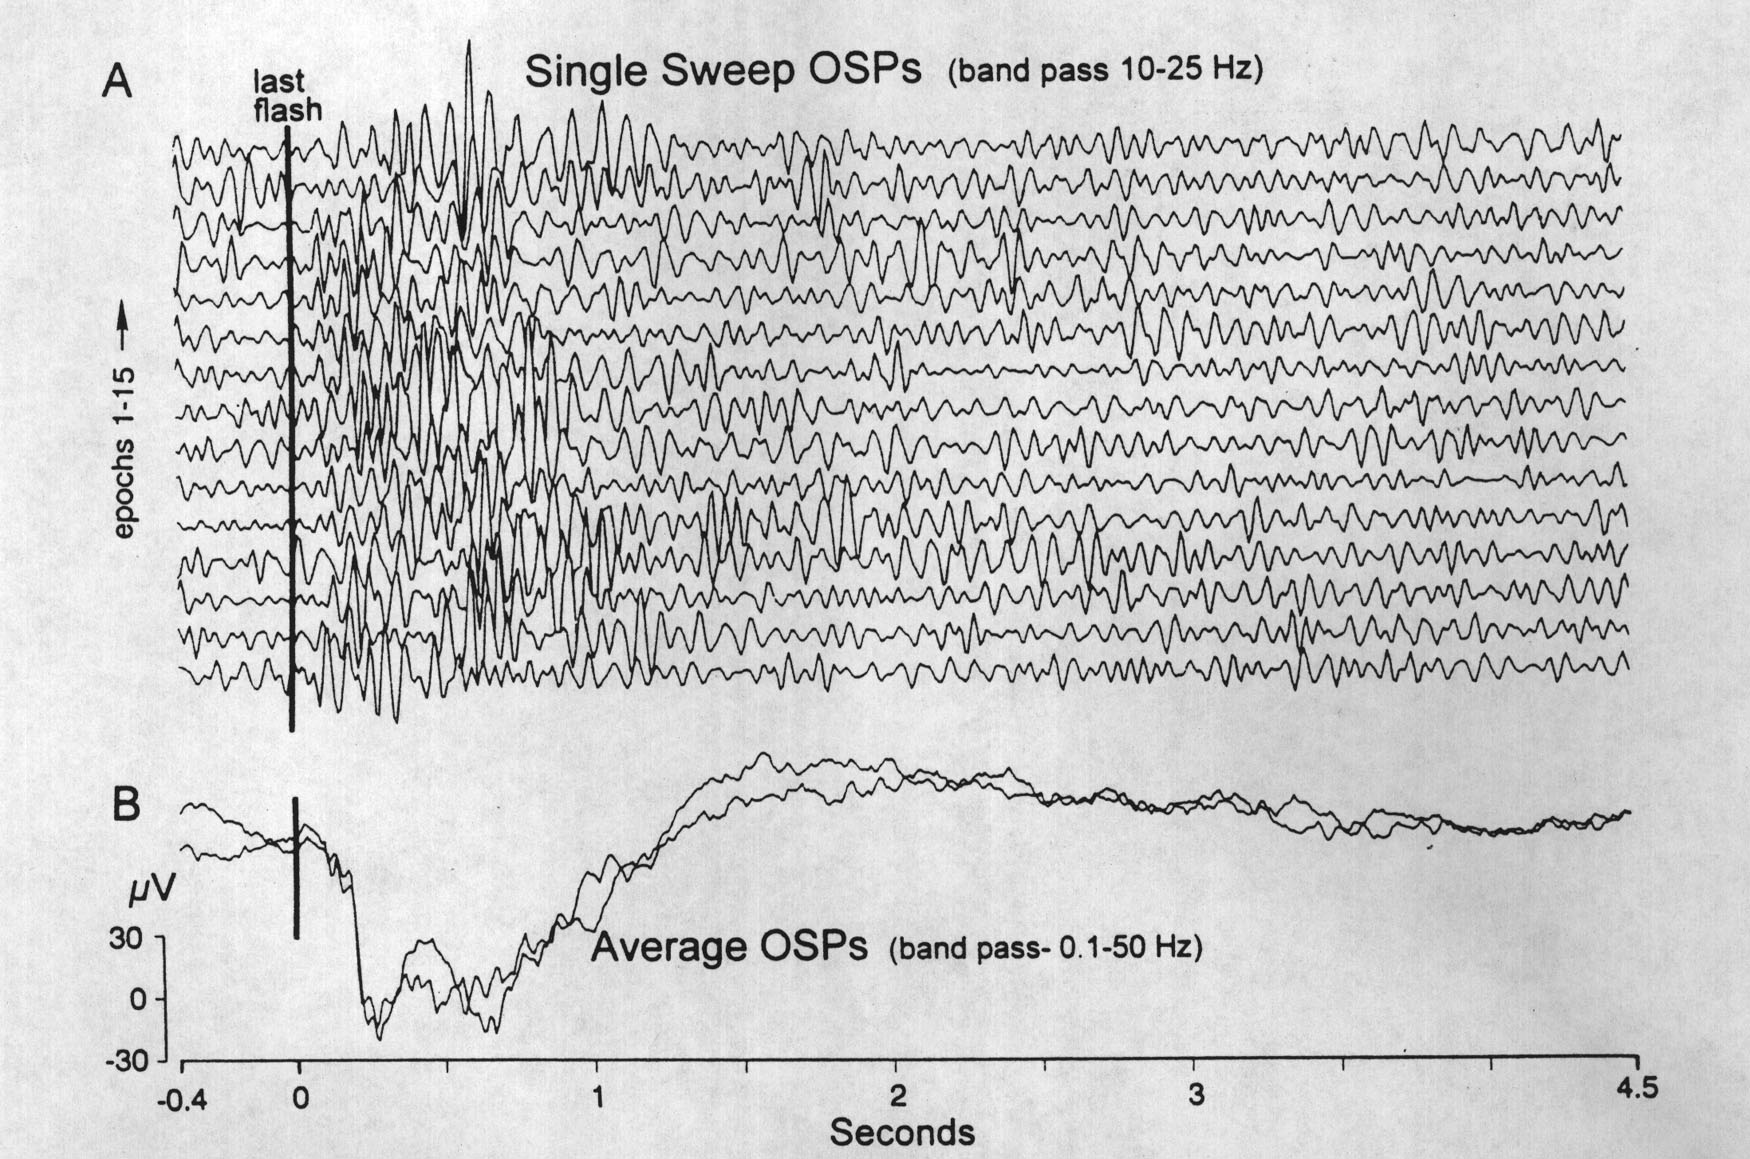 |
Fig. 5. A. Consecutive single sweeps of 10-25 Hz band-passed OSPs after a 10 s, 20 Hz train, showing ca. 15-20 Hz bursts of induced rhythms approximately time-locked to the omission. The phase of the rhythm is not time-locked to the stimulus. B. Broad-band (0.1-50 Hz) averages of the same data bring out the slow components of the OSP and show that the rhythmic components are not preserved in the average because of inherent latency jitter. |
Effect of Conditioning Flash Repetition Rate
In both tectum and DC late, slow waves fitting the definition of OSPs were discernible with conditioning rates as slow as 1.5 Hz (Fig. 2). Such slow waves as these P190-290 in tectum, N200 in DC) are unlikely to be late components of the VEP, first, because they are not seen in VEPs at longer ISIs and, second, because they are time-locked to the due-time when flash rate in the train is changed to 2, 4, 5, 6 Hz and higher frequencies. Only 3 and 7 Hz responses are anomalous (see next paragraph). In both forebrain and tectum, the OSPs after low frequency trains (< 6 Hz) consist only of such slow components, whereas, trains of higher repetition rate give early sharp components before the slow potentials (Fig. 2A and 2B).
Although flash rate in the conditioning train had consistent effects on the size and composition of OSPs, the effects showed some discontinuities across the flash frequencies. Some frequencies had specific effects on OSP shape and latency. The peak latency of the OSP after 3 Hz flashes in both forebrain and tectum is longer than that of neighboring frequencies (Fig. 2A), and the 7 Hz OSP is larger than the 6 and 8 Hz OSPs. In the forebrain, the 7 Hz OSP includes an unexpectedly large and late peak, N240-260. Such a late peak is small or absent in the 6 and 8 Hz OSPs.
Since the near constant latency of the response to the omission suggests an apparent expectation, it is desirable to try to manipulate expectation. One way is to reduce it by making the conditioning train less regular. The OSP after a regular 5 Hz flash train (ISI constant at 200 ms) was compared to OSPs generated in the same session with jittered flash trains, composed of pseudo-random series of flash intervals. In the low jitter condition ISI was on average 200 ms but varied between 150 and 250 ms, and in the high jitter condition the mean was also 200 ms but the ISIs varied between 100 and 300 ms. The last interval of all trains was 200 ms because it had been found in earlier work on fish (Bullock et al. 1993) that the last ISI has a strong effect. The finding with high jitter was that the OSP is almost abolished; under low jitter it is only reduced by ca. 50%. Both kinds of jittered trains show successive VEPs of large, irregular amplitudes.
Effect of Train Duration
Most of the analyses were based on OSPs collected with 10 s trains after 10 s rest periods. To examine the effects of train duration and conditioning frequency we compared the OSPs generated with 1, 2 and 4 s trains in combination with 5, 10 and 15 Hz flash frequencies. The different train types were presented in an interleaved way to control for non-stationarity; the interval between successive trains was at least 10 s. Shorter trains had longer inter-train intervals although the interval between successive omitted stimuli was always 20 s. For the comparison the data from the four best electrode sites in each of four animals were examined individually and pooled.
On several individual channels the OSPs after 4 s and 2 s trains of high rate conditioning flashes (15 Hz) were marginally but consistently larger than those after the 1 s trains. Deep tectal recordings of the larger OSPs with the longer 15 Hz trains are also associated with greater numbers of broad negative waves. If all channels within a subject were pooled, however, reliable differences between train durations were found only with the lower frequency OSPs. With the 5 Hz flashes the OSPs elicited by 2 s and 4 s trains did not differ significantly but both were larger than the OSP of the 1 s train (21% and 39% larger, p values < 0.05). For 10 Hz stimuli only the 4 s train OSP was significantly larger than the OSPs of the 1 s train (by 42%, p < 0.05).
The net result of these trains is that short trains, such as 5 or 10 flashes at 5 or 10 Hz are quite adequate to elicit good OSPs, almost as large as longer trains. We did not systematically test still shorter trains.
Stimulus Requirements
Higher flash intensities within limits increase the amplitude and decrease the latency of the principal wave of VEPs. To examine the effects of flash intensity and background illumination on the OSP, turtles were tested in opaque chambers illuminated with either bright overhead room lights (ca. 88 lux) or by a bulb with 3 V or 6 V (0.2 or 6 lux) and stimulated with strobe flashes of (arbitrary) intensities of #1, #4 and #16 (Grass PS22 photic stimulator settings, proportional to flux). The low background illumination compared to the high background, decreased the peak latency of the forebrain OSP slow potential (10 Hz conditioning) by more than 100 ms but did not substantially change the earlier peak or either wave in the tectum. High flash intensities compared to low intensities, had a similar effect on the peak latency of the forebrain late slow potential but no consistent effects on OSP amplitude or tectal latency.
OSPs were also elicited with dark flashes formed by 50 ms interruptions of the continuous illumination of a glow modulator. The stimulus omissions were presented after 10 s trains of 4, 6 or 10 Hz dark flashes. The dark flash OSPs recorded in the dorsal cortex began with a negative wave that peaked at N200 after the first omitted stimulus due-time, and was followed by a larger slow negative potential (N400-500; Fig. 6) that often included oscillations at ca. 20 Hz. The early negative wave was ca. 60 ms later than its counterpart in the bright flash OSP; and this may be due in part to the 50 ms duration and low intensity of the flash. The slow negative potential, however, was particularly late and variable, peaking in the range 400-500 ms. Its size in individual epochs was also labile in comparison to the bright flash OSP; in some sweeps it was not discernible.
 |
Fig. 6. Dark flash VEP and OSP. Two superimposed averages of the cortical VEP (upper trace) and the 4 Hz OSP (lower trace) obtained with dark flashes: 50 ms interruptions of steady light from a glow modulator. The dark flash OSP from DC is distinguished by a particularly late (N440) negative potential. Stimulus records indicate dark flashes; same time scale for both traces, time zero = due time of omitted stimulus. 10 sweeps/avg. |
Relation of OSP to Visual Evoked Potential
OSPs often shared several features with single flash VEPs at long ISI, recorded from the same electrode site. Different tectal and forebrain loci (DC or DVR) showed OSPs of different polarities (Figs. 2 and 4), and the polarities of the main early or late waves generally matched those of the corresponding VEPs. Forebrain OSPs that showed ca. 20 Hz oscillations were associated with VEPs that had similar oscillations. The late, broad negative waves of tectal OSPs at some loci were also found in the corresponding VEPs. Finally, stimulus manipulations that affected the size of the OSP, such as background illumination also affected the size of the VEP. For example, ipsilateral stimuli generated smaller, later VEPs with blunted shapes and the same was true of ipsilaterally stimulated OSPs.
To look for a possible relation between VEPs and OSPs, the topographic variation in amplitudes of OSPs and single flash (long ISI) VEPs from different forebrain electrodes in each of 18 subjects was examined. The two forms of response were separately standardized (z-transformed) for correlation analyses. The results indicate a significant correlation between VEP and OSP amplitudes (r = 0.79, p < 0.01).
Relation of OSP Amplitude to SSR Decrement due to Stimulus Rate
The amplitude of evoked potentials is well known to decline with high stimulation rates particularly in the range above 1 Hz (Ritter et al. 1968). As reported above, the amplitude of the OSP is also affected by the rate of the flashes in the conditioning train but in an opposite way (compare SSRs and OSPs in Fig. 2). To look for a relationship between these two trends, the OSP amplitudes from the best electrode loci in tectum and in forebrain were correlated with the immediately preceding last VEP of the train in the same locus. The values at different conditioning frequencies for each subject were first standardized (z-scores). The SSRs and OSPs of both tectum and cortex showed significant negative correlations (r = -0.74 and r = -0.66 respectively; p < 0.01).
OSPs from the Retina
OSPs of the turtle can be demonstrated in retinal and optic nerve recordings, as in fish (Bullock et al. 1990). However, under our conditions they seem to require higher conditioning frequencies (7 Hz) than more central stations. Simultaneous recordings from the retina (electrode in the vitreous body of the posterior chamber), tectum and dorsal cortex showed that after high conditioning frequencies the retinal OSP matches and leads the early waves of the tectal OSP by a few milliseconds (Fig. 7), suggesting that the retina is the origin of the tectal OSP. This relationship, however, does not hold at all conditioning frequencies. For example, 7 Hz conditioning in the same preparation generates clear tectal and forebrain OSPs at the same time that nothing similar is visible in the retinal record. Of course negative evidence might simply represent suboptimal electrode position and failure to record activity that was actually present. An explanation may lie in another apparent dissociation between retina and tectum; the former is more sensitive to conditioning frequency. If that frequency is increased from 10 to 15 Hz, the retinal OSP increases over 130 % in amplitude while the corresponding tectal OSP increases by less than 30 %. Perhaps the retinal OSP at 7 Hz is too small for our just detectable signal to noise ratio. We have not pursued the origin of the OSP within the retina by single cell recording from known cell types.
In the extensive literature on retinal physiology, including that of turtles, we do not find such a train-OFF potential reported, nor a study of the transition from single flash (long ISI) response to the steady state response at different ISIs. A parametric study of these dynamic properties is needed.
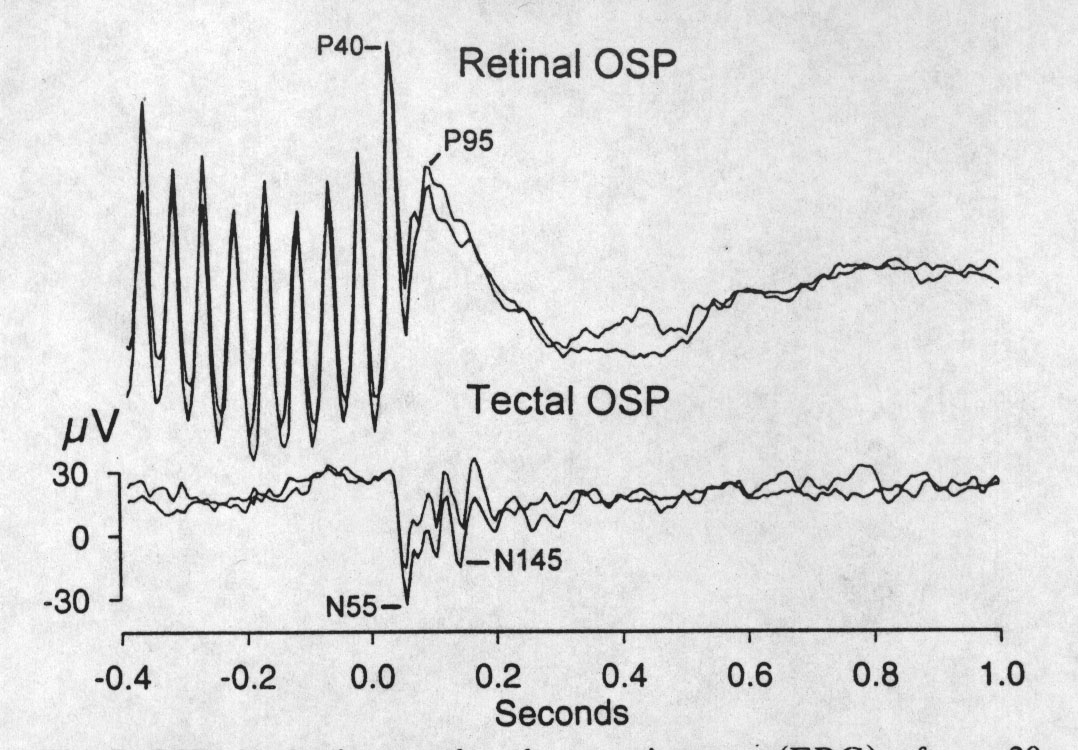 |
Fig. 7. OSPs in the intraocular electroretinogram (ERG), after a 20 Hz train, consist of sharp waves beginning between 40 and 100 ms after the due-time of the first missing flash, followed by slow potentials that last several hundred milliseconds. The OSP recorded simultaneously in the contralateral optic tectum, which cannot follow the flashing at this rate, is an OFF effect with roughly corresponding early waves (e.g. N55) plus others such as the N145 that are not apparent in the ERG. Consecutive averages of 20 epochs, omitted stimulus at zero on the abscissa. |
|
|
Discussion |
|
|
|---|
ERPs, of which OSPs are a special, sometimes called "emitted" class, have been considered in the literature to reflect fundamental cognitive processes. In humans they are correlated with changes in cognitive variables and they are reduced in infants and the senile, under sleep and drugs that obtund consciousness (Picton et al. 1976, 1978; Courchesne 1979; McCallum 1980; Stapleton and Halgren 1987; Hillyard and Picton 1987; Woods 1990). This study is one of a series asking whether they are different or absent in nonmammalian vertebrates. We do not know or attempt to measure the cognitive status of the turtle but agree with the position (Bullock 1982, 1993) that in nonhuman species this is a question of degree rather than being all or none. If ERPs of this kind are indeed signs of cognition, especially if they are in some sense a function of, or graded with it, they might help in making this assessment. Even if such help is too much to expect, simply searching for stages in the evolution of ERPs under the paradigms that elicit mental events in humans, is of interest, given the wide diversity of major taxa and their large differences in brain structure and behavioral repertoires.
The conclusion we draw from the present experiments, as from the fish data, is that large ERPs occur in species, brain regions and conditions that probably involve minimal cognition. We also conclude that OSPs in the range of conditioning frequencies > 5 Hz may be quite distinct from those after lower frequencies of flashes, such as the range used in the literature for humans and cats. Two important gaps in our knowledge are (i) the domain of conditioning frequencies >5 Hz in humans (Bullock et al. 1994) or other mammals and (ii) the responses to omissions as recorded from brainstem levels.
Comparison with OSPs of Other Vertebrates and a Suggested Mechanism
Many of the dynamic properties of the turtle OSPs, that is, how they change with time and temporal patterns of stimulus repetition are similar to those in the species of elasmobranchs and teleosts previously reported, including their presence in the retina (Bullock et al. 1990, 1993). The OSP in the species of reptile studied appears to behave sufficiently like that in the several species of fish we previously studied that we can apply the same tentative interpretation (Bullock et al. 1990). Inhibition or a depressing influence is stimulated by each flash, coexisting with excitation; it diminishes the VEP with each successive flash in a selective manner, reducing short latency components most. The inhibition could be an intracellular self-inhibition or a network property of the retinal and brain circuitry. The inhibitory process begins very promptly and suppresses the early part of the VEP, then declines with time. Within a few cycles of repeated stimuli the interaction of the inhibitory and excitatory processes comes to an equilibrium which is specific to the ISI. Omission or even a slight delay of a stimulus (5 ms in the ray) deprives the equilibrium of the inhibitory input that has been holding down the late components of the VEP. The OSP is then a rebound excitation released at a specific latency after the last stimulus, equal to the previous ISI plus a fixed latency nearly constant over a range of ISIs. The rebound can be complex, with early brief and later slower phases and a facultative, late, induced oscillation for several hundred milliseconds.
A difference between the OSP in the nonmammalian species studied and in the human and the few other mammals studied is the effective range of conditioning ISIs. In the fish and reptile species studied we have seen no consistent P500-900 as in humans and no OSP after conditioning below 1.5 Hz under our conditions, with attention not controlled and probably minimal or absent. The several studies of the human scalp-recorded OSP (refs. in Bullock et al. 1994), using ISIs from 0.6-3 s, have shown that attention is necessary for OSPs in this range. Recent experiments in this laboratory (loc. cit.) have revealed two ranges and types of response in humans, with a discontinuity between them. Above 5 Hz we have found the human OSP is not unlike that in the fish and reptiles studied; it does not require attention. It remains to study reptiles and fish in the long ISI range after training, to gain attention. The high frequency OSP in humans was found also to look like those in nonmammals - with early, N120, and late, P225 waves, after the first due-time, plus facultative components even later.
Besides the human, the only other species (references cited in Introduction) with which we can compare the turtle OSP properties are three elasmobranchs, three teleosts, and the cat. ERP data from rat and monkey come from oddball or conditioning paradigms. These ERPs might have some mechanisms in common with the OSPs, at least for the long-ISI (>1 s) range but probably not for the range of ISIs <0.5 s. The fish and turtle evidence suggests an important role of the retina in initiating the OSP. The short-ISI OSP has much in common in the species of fish and reptile studied. An important conclusion is that brainstem and retinal levels should be investigated in mammalian subjects.
Even if the response type is different in dynamic properties, one may ask whether there is some homology or basic equivalence between particular waves in the human and the turtle forebrain OSP of about the same latency. If such a relationship could be supported, it would presumably mean that the cell groups or sources of the waves in question must be homologous. Lacking an adequate analysis of the cell groups responsible in the two species, we do not argue for any fundamental equivalence, nor against it. Form and latency of the waves are even less indicative: OSPs in the turtle can vary in shape and latency with electrode placement and unknown factors. Furthermore, there is no unequivocal way to compare latency in species with a different body temperature, except very roughly.
The 17-25 Hz oscillatory component of the forebrain OSP may not be unique to the turtle and, in view of the temperature difference, might be compared with gamma band oscillation in mammals. We would not expect to observe the same kind of oscillation in human scalp data because it is a non-phase-locked kind and attenuates in averages. In the turtle it is seen best with intracortical electrodes and single sweeps. We have recently found a similar but longer lasting ca. 20 Hz oscillatory activity in the same species of turtles (Prechtl and Bullock 1993b), triggered by moving visual stimuli and reminiscent of the gamma band oscillation in the cat visual cortex (Eckhorn et al. 1988; Gray and Singer 1989). Curiously, the similar 17-25 Hz oscillation late in the OSP of elasmobranchs (Bullock et al. 1990, 1993) was only seen in the tectum and not in the forebrain. It occurs in the ray tectum also in well-rested VEPs and in the OFF response to a long (>500 ms) light. Gamma band induced rhythms are widespread (Bullock 1992) and may not be everywhere equivalent in nature.
Comparison of VEP and OSP
Human scalp-recorded sensory VEPs and some ERPs include a large early negative wave known as the vertex potential or the N1. The rested VEP from the forebrain of the reptile is dominated by a large, sharp early wave (N100-125 ms at the surface; see Fig. 4 middle panel), referred to here as the principal wave, that appears to have some similarities with the N1 of the human ERP. In addition to being large, early and surface negative, the principal wave of the turtle cortex, like the human N1 is evoked by abrupt changes in steady-state stimulation, and varies as a function of stimulus parameters (Prechtl and Bullock 1993a); thus it is relatively exogenous. Moreover, both the principal wave of the turtle VEP and the N1 of the human ERP show little variance or habituation between successive trials and both are relatively insensitive to barbiturate (Cigánek 1961; Domino et al. 1963; Prechtl and Bullock 1992).
In the published reports of human OSPs, (long-ISI, >0.8 s), the N1 is absent (Loveless 1983) and the same is true of the principal wave and OSP of the turtle (short ISI, <0.5 s). For example, in Fig. 4 (middle plot) the unambiguous principal wave of the VEP (surface N100/deep P100), is not reproduced in the corresponding OSP (right panel); the most comparable OSP wave is a small surface N120/deep P120. This interpretation is consistent with the longer onset and peak latencies of the OSPs (Table 1). In contrast, when visual oddball stimuli are used in the turtle the principal wave is preserved (Prechtl and Bullock 1993a) perhaps as a relatively exogenous component.
Anatomical Origins of OSPs
The locus or loci of origin constitute an important part of the characterization of an ERP and of the consideration with respect to homology of waves. The visual OSP of the turtle clearly does not come from one place; activity within the definition given can be localized at least to DC, DVR, optic tectum and retina. We have not explored the thalamus, medial or lateral cortex or other possible sources.
The thalamo-cortical pathway is similar to the mammalian geniculocortical system (Hall et al. 1977) and terminates in the three-layered dorsal cortex (DC, Fig. 1B). It shares numerous structural (Northcutt 1981; Ulinski 1990), neurochemical (Kriegstein and Connors 1986; Reiner 1991) and physiological (Connors and Kriegstein 1986) features with the mammalian isocortex. The tectofugal pathway is less studied but represents the larger pathway in the nonmammalian amniotes. Its terminal structure, the DVR, is nonlaminar and has been hypothesized to be the analogue of extrastriate cortex (Karten and Shimizu 1990). In addition to the direct visual pathways, one may expect ERPs in hypothalamus, septal or hippocampal as well as striatal regions and even in cerebellum, where good visual evoked responses occur.
OSPs are not simply relayed from the point of origin in the retina and repeated without change in later centers. Each level clearly modifies the form and timing of the response of earlier levels. Tectal OSPs often include broad negative waves that have no counterpart in the forebrain. Only the forebrain shows spindle-like 17-25 Hz oscillations in the turtle; in contrast rays have 17-25 Hz oscillations in the tectum and not in the forebrain (Bullock et al. 1990, 1993). We see no reconciliation at the moment for this possibly major species difference. OSPs seem to be elaborated at the different brain levels in different ways but we do not know, for those above the retina, whether they would occur after a conditioning train if the retinal OSP were blocked or the train delivered as shocks to the optic nerve.
Sensory Memory and Response Decrement
Because the OSP is found in a wide range of vertebrates and at different levels of the nervous system it must reflect some rather basic mechanisms called into play by repeated stimuli of more or less uniform ISI. The OSP latency after different conditioning ISIs suggests an apparent expectation that involves a kind of short term memory. Too little is known about neural mechanisms of information processing to hypothesize a specific function for the OSP - as for the other classes of ERPs. A case has been made for the speculation that they are more than mere signs of interesting mental events; given the newer appreciation of nonspike forms of communication between brain cells, they might have some causative or modulatory role upon the neurons in the neighborhood (Bullock 1989, 1993). Further comparative work on the extent of reciprocal connections among structures in afferent pathways might suggest whether recurrent processing, rather than the simple feed-forward, may be important in this type of short term memory. Recurrent processing might require - or provide - the kind of persistence of information manifested by the dynamics of the OSP.
|
|
Acknowledgement/References |
|
|
|---|
We are indebted to A. Brzozowska-Prechtl for her technical assistance.
Arthur, D.L. and Starr, A. Task-relevant late positive component of the auditory event-related potential in monkeys resembles P300 in humans. Science, 1984, 223: 186-188.
Baar-Eroglu, C. and Baar, E. Endogenous components of event-related potentials in hippocampus: an analysis with freely moving cats. Electroenceph. clin. Neurophysiol. Suppl., 1987, 40: 440-444.
Baar-Eroglu, C., Baar, E. and Schmielau, F. P300 in freely moving cats with intracranial electrodes. Int. J. Neurosci., 1991a, 60: 215-226.
Baar-Eroglu, C., Schmielau, F., Schramm, U. and Schult, J. P300 response of hippocampus analyzed by means of multielectrodes in cats. Int. J. Neurosci., 1991b, 60: 239-248.
Bass, A.H., Andry, M.L. and Northcutt, R.G. Visual activity in the telencephalon of the painted turtle, Chrysemys picta. Brain Res., 1983, 263: 201-210.
Buchwald, J.S. Comparisons of sensory and cognitive brain potentials in the human and in an animal model. In: E. Baar and T.H. Bullock (Eds.), Brain Dynamics: Progress and Perspectives. Springer, Berlin, 1989: 242-257.
Buchwald, J.S. Comparison of plasticity in sensory and cognitive processing systems. Clin. Perinatol., 1990, 17: 57-66.
Bullock, T.H. Afterthoughts on animal minds. In D.R. Griffin (Ed.), Animal Mind - Human Mind. Springer, Berlin, 1982: 407-413.
Bullock, T.H. The micro-EEG represents varied degrees of cooperativity among wide-band generators: spatial and temporal microstructure of field potentials. In: E. Baar and T.H. Bullock (Eds.), Brain Dynamics: Progress and Perspectives. Springer, Berlin, 1989: 5-12.
Bullock, T.H. Introduction to induced rhythms: a widespread, heterogeneous class of oscillations. In: E. Baar and T.H. Bullock (Eds.), Induced Rhythms in the Brain. Birkhäuser, Boston, 1992: 1-26.
Bullock, T.H. How Do Brains Work? Papers of a Neurophysiologist. Birkhäuser, Boston, 1993.
Bullock, T.H. and Budelmann, B.U. Sensory evoked potentials in unanesthetized unrestrained cuttlefish: a new preparation for brain physiology in cephalopods. J. Comp. Physiol. A, 1991, 168: 141-150.
Bullock, T.H., Hofmann, M.H., Nahm, F.K., New, J.G. and Prechtl, J.C. Event-related potentials in the retina and optic tectum of fish. J. Neurophysiol., 1990, 64: 903-914.
Bullock, T.H., Karamürsel, S., Achimowicz, J.Z., McClune, M.C., Baar-Eroglu, C. and Baar, E. Dynamic properties of human visual evoked and omitted stimulus potentials, 1994: submitted with the present MS.
Bullock, T.H., Karamürsel, S. and Hofmann, M.H. Interval specific event related potentials to omitted stimuli in the electrosensory pathway in elasmobranchs: an elementary form of expectation. J. Comp. Physiol. A, 1993, 172:501-510.
Cigánek, L. The EEG response (evoked potential) to light stimulus in man. Electroenceph. clin. Neurophysiol., 1961, 13: 165-172.
Connors, B.W. and Kriegstein, A.R. Cellular physiology of the turtle visual cortex: distinctive properties of pyramidal and stellate neurons. J. Neurosci., 1986, 6: 164-177.
Courchesne, E. From infancy to adulthood: the neurophysiological correlates of cognition. In: J.E. Desmedt (Ed.), Cognitive Components in Cerebral Event-Related Potentials and Selective Attention. S. Karger, Basel, 1979: 224-242.
Domino, E.F., Corssen, G. and Sweet, R.B. Effects of various general anesthetics on the visually evoked response in man. Anesth. Analg., 1963, 42: 735-747.
Eckhorn, R., Bauer, R., Jordan, W., Brosch, M., Kruse, W., Munk, M. and Reitböck, H.J. Coherent oscillations: a mechanism for feature linking in the visual cortex? Biol. Cybern., 1988, 60: 121-130.
Gray, C.M. and Singer, W. Stimulus-specific neuronal oscillations in orientation columns of cat visual cortex. Proc. Natl. Acad. Sci. U. S. A, 1989, 86: 1698-1702.
Hall, J.A., Foster, R.E., Ebner, F.F. and Hall, W.C. Visual cortex in a reptile, the turtle (Pseudemys scripta and Chrysemys picta). Brain Res., 1977, 130: 197-216.
Harrison, J., Buchwald, J. and Kaga, K. Cat P300 present after primary auditory cortex ablation. Electroenceph. clin. Neurophysiol., 1986, 63: 180-187.
Hillyard, S.A. and Kutas, M. Electrophysiology of cognitive processing. Annu. Rev. Psychol., 1983, 34: 33-61.
Hillyard, S.A. and Picton, T. Electrophysiology of cognition. In: F Plum (Ed.) Handbook of Physiology: The Nervous System. Vol V, Part 2, Higher Functions of the Brain. American Physiological Society, Bethesda, MD, 1987: 519-584.
Hurlbut, B.J., Lubar, J.F. and Satterfield, S.M. Auditory elicitation of the P300 event-related evoked potential in the rat. Physiol. Behav., 1987, 39: 483-487.
John, E.R. and Schwartz, E.L. The neurophysiology of information processing and cognition. Annu. Rev. Psychol., 1978, 29: 1-29.
Karamian, A.I., Vesselkin, N.P., Belekhova, M.G. and Zagorulko, T.M. Electrophysiological characteristics of tectal and thalamo-cortical divisions of the visual system in lower vertebrates. J. Comp. Neurol., 1966, 127: 559-576.
Karamürsel, S. and Bullock, T.H. Dynamics of event-related potentials to trains of light and dark flashes: responses to missing and extra stimuli in rays. 1994: submitted with the present MS.
Karten, H.J. and Shimizu, T. The origins of the neocortex: connections and lamination as distinct events in evolution. J. Cog. Neurosci., 1990, 1: 291-301.
Kriegstein, A.R. and Connors, B.W. Cellular physiology of the turtle visual cortex: synaptic properties and intrinsic circuitry. J. Neurosci., 1986, 6: 178-191.
Loveless, N.E. The orienting response and evoked potentials in man. In: D. Siddle (Ed.), Orienting and Habituation: Perspectives in Human Research. John Wiley & Sons, New York, 1983: 71-108.
McCallum, W. C. Brain slow potential changes elicited by missing stimuli and by externally paced voluntary responses. Biol. Psychol. 1980, 11:7-19.
Northcutt, R.G. Evolution of the telencephalon in nonmammals. Annu. Rev. Neurosci., 1981, 4: 301-350.
Pineda, J.A., Foote, S.L., Neville, H.J. and Holmes, T.C. Endogenous event-related potentials in monkey: the role of task relevance, stimulus probability, and behavioral response. Electroenceph. clin. Neurophysiol., 1988, 70:155-171.
Picton, T. W., Hillyard, S. A., and Galambos, R. Habituation and attention in the auditory system. In: Handbook of Sensory Physiology. Vol. 5. The Auditory System, edited by W. Keidel and W. Neff. Springer-Verlag, Berlin, 1976, pp. 343-389.
Picton, T. W., Campbell, K. B., Baribeau-Braun, J., and Proulx, G. B. The neurophysiology of human attention: a tutorial review. In: Attention and Performance, edited by J. Requin. Lawrence Erlbaum, Hillsdale, NJ, 1978, pp. 429-467.
Pirch, J.H., Corbus, M.J. and Ebenezer, I. Conditioned cortical slow potential responses in urethane anesthetized rats. Int. J. Neurosci., 1985, 25: 207-218.
Pirch, J.H., Corbus, M.J., Rigdon, G.C. and Lyness, W.H. Generation of cortical event-related slow potentials in the rat involves nucleus basalis cholinergic innervation. Electroenceph. clin. Neurophysiol., 1986, 63: 464-475.
Powers, A.S. and Reiner, A. A stereotaxic atlas of the forebrain and midbrain of the eastern painted turtle (Chrysemys picta picta). J. für Hirnforschung., 1980, 21: 125-159.
Prechtl, J.C. and Bullock, T.H. Event related potentials in tectum and cortex of freely moving turtles to visual stimuli. Soc. Neurosci. Abstr., 1990, 16: 920.
Prechtl, J.C. and Bullock, T.H. Barbiturate sensitive components of visual ERPs in a reptile. Neuroreport, 1992, 3: 801-804.
Prechtl, J.C. and Bullock, T.H. Plurality of visual mismatch potentials in a reptile. J. Cog. Neurosci., 1993a, 5: 177-187.
Prechtl, J.C. and Bullock, T.H. Motion driven 20 Hz oscillations in turtle visual cortex. Soc. Neurosci. Abstr., 1993b, in press.
Reiner, A. A comparison of neurotransmitter-specific and neuropeptide-specific neuronal cell types present in the dorsal cortex in turtles with those present in the isocortex in mammals: implications for the evolution of isocortex. Brain Behav. Evol., 1991, 38: 53-91.
Ritter, W., Vaughan, H.G. and Costa, L.D. Orienting and habituation to auditory stimuli: a study of short-term changes in average evoked responses. Electroenceph. clin. Neurophysiol. 1968, 25: 550-556.
Rogers, R.L., Papanicolaou, A.C., Baumann, S.B. and Eisenberg, H.M. Late magnetic fields and positive evoked potentials following infrequent and unpredictable omissions of visual stimuli. Electroenceph. clin. Neurophysiol., 1992, 83: 146-152.
Simson, R., Vaughan, H.G. and Rittter, W. The scalp topography of potentials associated with missing visual and auditory stimuli. Electroenceph. clin. Neurophysiol., 1976, 40: 33-42.
Stapleton, J. M. and Halgren, E. Endogenous potentials evoked in simple cognitive tasks: depth components and task correlates. Electroencephalogr. clin. Neurophysiol., 1987, 67:44-52.
Ulinski, P.S. The cerebral cortex of reptiles. In: E.G. Jones and A. Peters (Eds.), Cerebral Cortex, Comparative Structure and Evolution of Cerebral Cortex, part 1. Plenum Press, New York, 1990: 139-215.
Wilder, M.B., Farley, G.R. and Starr, A. Endogenous late positive component of the evoked potential in cats corresponding to P300 in humans. Science, 1981, 211: 605-607.
Woods, D.L. The physiological basis of selective attention: implications of event-related potential studies. In: J.W. Rohrbaugh, R. Johnson and R. Parasuraman (Eds.), Event-Related Brain Potentials: Issues and Interdisciplinary Vantages. Oxford Press, New York, 1990: 178-209.
Yamaguchi, S., Globus, H. and Knight, R.T. P3-like potential in rats. Electroenceph. clin. Neurophysiol., 1993, 88: 151-154.
|
|
Footnotes |
|
|
|---|
1. National Research Service Award Fellow of the National Institutes of Health
2. Aided by grants from the National Institute of Neurological Diseases and Stroke