![]() Top/Acknowledgements
Top/Acknowledgements
![]() Abstract
Abstract
![]() Materials &
Methods
Materials &
Methods
![]() Results
Results
![]() Discussion
Discussion
![]() References
References
![]() Abbreviations
Abbreviations
The Journal of Neuroscience, September 15, 1998, 18(18):7381-7393
|
|
|---|
James C. Prechtl1, Gerhard von der Emde2, Jakob Wolfart1, Saçit Karamürsel3, George N. Akoev4, Yuri N. Andrianov4, and Theodore H. Bullock1
1 Neurobiology Unit, Scripps Institution
of Oceanography, University of California San Diego, La Jolla,
CA 92093
2 Zoologisches Institut, Universität Bonn, 53115 Bonn, Germany
3 Center for Electroneurophysiology, Istanbul University School
of Medicine, 34390 Istanbul, Turkey
4 Pavlov Institute of Physiology, Russian Academy of Sciences,
199034 St. Petersburg, Russia.
Abbreviated Title: Sensory processing in a teleost pallium
Editorial Correspondence:
Theodore H. Bullock
Neurobiology Unit,
0201 Scripps Institution of Oceanography
University of California San Diego
La Jolla, CA 92093-0201
tel. (619) 534-3636; fax (619) 534-3919 E-mail: tbullock@ucsd.edu
|
|
Acknowledgements |
We thank Andrea Thor and Agnieszka Brzozowska-Prechtl for histology assistance. Calvin J.H. Wong provided thoughtful advice and generous help accommodating visiting Heiligenberg Scholars who participated in the study. Silicon probes were provided by the University of Michigan Center for Neural Communication Technology which is sponsored by a National Institutes of Health / NCRR grant. This work comes from the laboratory of the late Walter F. Heiligenberg and was supported by grants from the National Institute of Neurological Diseases and Stroke, the National Institute of Mental Health and the National Science Foundation.
|
|
Abstract |
|
|
|---|
To investigate the functional organization of higher brain levels in fish we test the hypothesis that the dorsal gray mantle of the telencephalon of a mormyrid fish has discrete receptive areas for several sensory modalities. Multiunit and compound field potentials evoked by auditory, visual, electrosensory and water displacement stimuli in this weakly electric fish are recorded with multiple semimicroelectrodes placed in many tracks and depths in or near area dorsalis telencephali, pars medialis (Dm). Most responsive loci are unimodal; some respond to two or more modalities. Each modality dominates a circumscribed area, chiefly separate. Auditory and electrical responses cluster in the dorsal 500 m of rostral and caudolateral Dm, respectively. Two auditory subdivisions underline specialization of this sense. Mechanoreception occupies a caudal area overlapping electroreception but centered 500 m deeper. Visual responses scatter widely through ventral areas. Auditory, electrosensory and mechanosensory responses are dominated by a negative wave within the first 50 ms, followed by 15-55 Hz oscillations and a slow positive wave with multiunit spikes lasting from 200-500 ms. Stimuli can induce shifts in coherence of certain frequency bands between neighboring loci. Every electric organ discharge command is followed within 3 ms by a large, mainly negative but generally biphasic, widespread corollary discharge. At certain loci large, slow ("delta F") waves usually precede transient shifts in electric organ discharge rate. Sensory evoked potentials in this fish pallium may be more segregated than in elasmobranchs and anurans and have some surprising similarities to those in mammals. Key Words: cerebral cortex; corollary discharge; induced rhythms; evoked potential; gamma band; lateral line; mormyrid.
The pallium is a general term for a mantle of gray matter that covers the telencephalon. In mammals it includes the cortex. Although, the pallium is one of the most intensely studied structures in mammals, in nonmammalian brain physiology it is perhaps the most neglected. We address the question whether this higher brain level in fish is basically different in functional organization from that familiar in mammals. We chose to investigate sensory representation of multiple modalities in the pallium of a teleost with an elaborated brain (Butler and Hodos 1996).
Before recent anatomical tracer studies, the teleost pallium was considered to bedominated by olfactory input and involved primarily in mechanisms of arousal (Ito and Kishida, 1978; Finger, 1980), and in sequencing of elementary "fixed action patterns"(Segaar, 1961; De Bruin, 1980). Multimodal sensory functions converging in the forebrainwere strongly suggested by the results of ablation: impairment of habituation to stimuli(Laming and McKee, 1981) and hyperdefensiveness or overreacting to familiar stimuli(Davis and Kassel, 1983).
We approach telencephalic sensory function by surveying the distributions andproperties of evoked responses to several forms of stimuli. The chosen material is the highly differentiated pallium of Gnathonemus petersii (elephant nose fish, Mormyridae,Osteoglossiformes), an African freshwater weakly electric fish that continuously discharges brief electric pulses with varying interpulse intervals. The electric fields are used to localize and identify objects with different ohmic and capacitative electrical impedances than the ambient water (von der Emde, 1990, 1998; Bastian, 1994) and tosignal social states to other fish (Hopkins, 1988). They also show broad-frequencyvocalization (Rigley and Marshall, 1973), and have an exceptionally sensitive auditorysystem (McCormick and Popper, 1984). Gnathonemus has a reduced visual system butcan use visual cues in social and other behaviors (Cialo et al., 1997; Moller, 1995; von der Emde and Bleckman, 1998).
Our aims are to analyze compound field potentials, including slow, local field potentials (LFPs) and multiunit spike responses recorded concurrently at multiple loci. Unlike some electroencephalographic measures, compound field potentials (CFPs)recorded with semi-microelectrodes include highly local signals generated within 50-200 µm of the electrode tip (Bullock, 1997; Fig. 4a). LFPs, both spontaneously and during evoked responses, may be partially correlated with intracellular potentials of local cells (Prechtl and Kleinfeld, 1997) and may predict the occurrence of spiking (Bullock, 1997). LFPs reflect the synchronous activity of cell populations and can provide information on cognitive or contextual aspects of sensory processing. The hypothesis we are testing is that an advanced teleost pallium has discrete receptive areas for each sensory modality, as measured with evoked responses, roughly analogous to the organization of the mammalian cerebral cortex.
Recent work in amniotes has shown that many sensory responses as well as certainbehavioral states include relatively high frequency oscillations (ca.15-55 Hz, "gamma"band; here extended somewhat lower than usual for warm-blooded animals because oursubjects are exothermic and at 24-27 C), and that temporal coordination of these oscillations may play a role in integration (Gray, 1994; Bullock, 1997). To examine forrhythmic response components that might not be closely phase-locked to the stimulus, theemphasis of the present analysis is on unaveraged trials. Multiple electrodes are used toexamine for signs of cooperativity among neighboring neural assemblies. By comparingsensory responses of amniote cortex with those of this tiny, everted pallium we aim to gain insight into features of brain physiology that are conserved and perhaps fundamental.
|
|
Materials and Methods |
|
|
|---|
Animals and surgery. Elephant-nose fish, Gnathonemus petersii, from tropical fish dealers (N=33; size ~10 cm) were maintained in filtered aquaria at 24-27 C on a 12:12 light-dark cycle. Experiments were conducted during the light cycle in room temperature water (22-24 C; 10-15 k·cm) under guidelines established by the University of California, San Diego and the National Institutes of Health.
Before craniotomy the animals were anesthetized by immersion in 0.01 % solution of tricaine methanesulfonate (MS-222), maintained during the surgery, and the incision area was coated with 2% lidocaine gel. After paralysis with 10-15 µl of 1% tubocurarine pentahydrate (i.m.; wt/vol), the fish was supported in a loose foam rubber clamp in an acrylic tank (40 x 40 x 15 cm) and respired with a mouth tube (1 to 2 drops/s). The skull was stabilized by cementing it to a clamped acrylic rod, and then drilled to expose the forebrain area. In most experiments the left hemisphere was sampled after its overlying portion of valvula was removed by aspiration; in some experiments the valvula was left intact. Water level was maintained above the level of the eyes and the animal's dorsum was kept moist by a wick of wet tissue paper.
Electrodes, recording and data analysis.
Commercially available tungsten or stainless steel microelectrodes (F. Haer INC., Brunswick, ME; Micro Probe INC., Clarksburg, MD) were used singly or in comb-like arrays of 3-6 with spacings of 100-500 µm. Initial electrode impedances of ca. 10 M were reduced to ca. 1 M by passing current and depositing platinum black. Some depth profiles were recorded with in-line, silicon electrode printed circuit arrays made by the Center for Neural Communication Technology (Univ. Michigan, Ann Arbor, MI). Field potentials were differentially recorded with the common reference wire in the nasal area, amplified, bandpassed (0.3-2000 Hz) and digitized at 4096 pts/s (DataWave Inc., Boulder,CO). A bipolar tail electrode was used to record concurrently the electric organ discharge motor command (EODC); it is probably a junction potential in the electrocytes while the natural discharge is blocked or reduced by the curare. Programs developed by M.C. McClune (UC San Diego) were used for off-line analyses of the data. Changes in coherence were calculated with Matlab by comparing 200 ms of baseline activity with the first 200 ms interval of the response. Coherence estimates (a frequency-specific measure of the correlation between two places) were averaged from ~5 responses in each animal and then combined and statistically evaluated with paired, two-tailed t-tests.
Sampling and histological reconstruction.
The dorsal pallium, except for its rostral tip, is divided into medial and lateral parts by the epsiliform sulcus (Fig. 1). A 3-axis hydraulic micromanipulator provided coordinates for several penetrations in each animal, each consisting of 30-50 advances of 50 µm. Electrode penetrations mostly traversed the telencephalic area dorsalis pars medialis (Dm) and the underlying Dm-associated part of area dorsalis pars centralis (Dcm; nomenclature adopted from Nieuwenhuys, 1963). Most of the Dm was sampled except for its caudo-medial pole (Fig. 1). Some experiments also included penetrations lateral to the epsiliform sulcus, through the area dorsalis pars dorsalis (Dd) and into Dd-associated part of the of the area dorsalis pars centralis (Dcd). Penetrations from the dorsal surface extended at least 1500-2000 µm deep and thus extended into structures under Dm (Figs 2 and 3). In 8 experiments the valvula was left intact and approximately the same pallial areas were sampled after traversing the ~ 2000 µm height of the valvula (Fig. 1A).
 |
Figure 1 Diagrams of gross anatomy of the Gnathonemus brain and the area sampled. A Cross hatched area indicates the segment of valvula that was removed on one side for most experiments. Dark shading approximates the area where most recordings were made. B Dorsal view of the cerebrum as though transparent that summarizes the horizontal distribution of unimodal octavolateral sensory responses. Center of mechanosensory response zone (thick line) lies ca. 400 µm ventral to the center of electrosensory area which is ca. 300 µm deep to the dorsal surface with almost no overlap (dashed line). Auditory zone also 0-500 µm deep, overlaps the electric. Stars represent the diffuse distribution of visually responsive loci, 600-1700 m below the surface. Cross section markers a-f indicate transverse reference planes used in Figs. 2 and 3. (See list of abbreviations) |
To establish reference points one or two recording loci were marked by lesions or by anodally deposited iron and then histologically processed (Cresyl Violet or Neutral Red and Prussian Blue staining) to localize the markings in coronal (=transverse) sections. The majority of loci were inferred directly from surface penetration marks of arrays in combination with depth coordinate records. Surface penetration maps with depth coordinates were translated into coronal loci. Rostro-caudal spacing of successive tracks varied but results were collapsed onto the six templates from a control brain (Figs. 1B and 2).
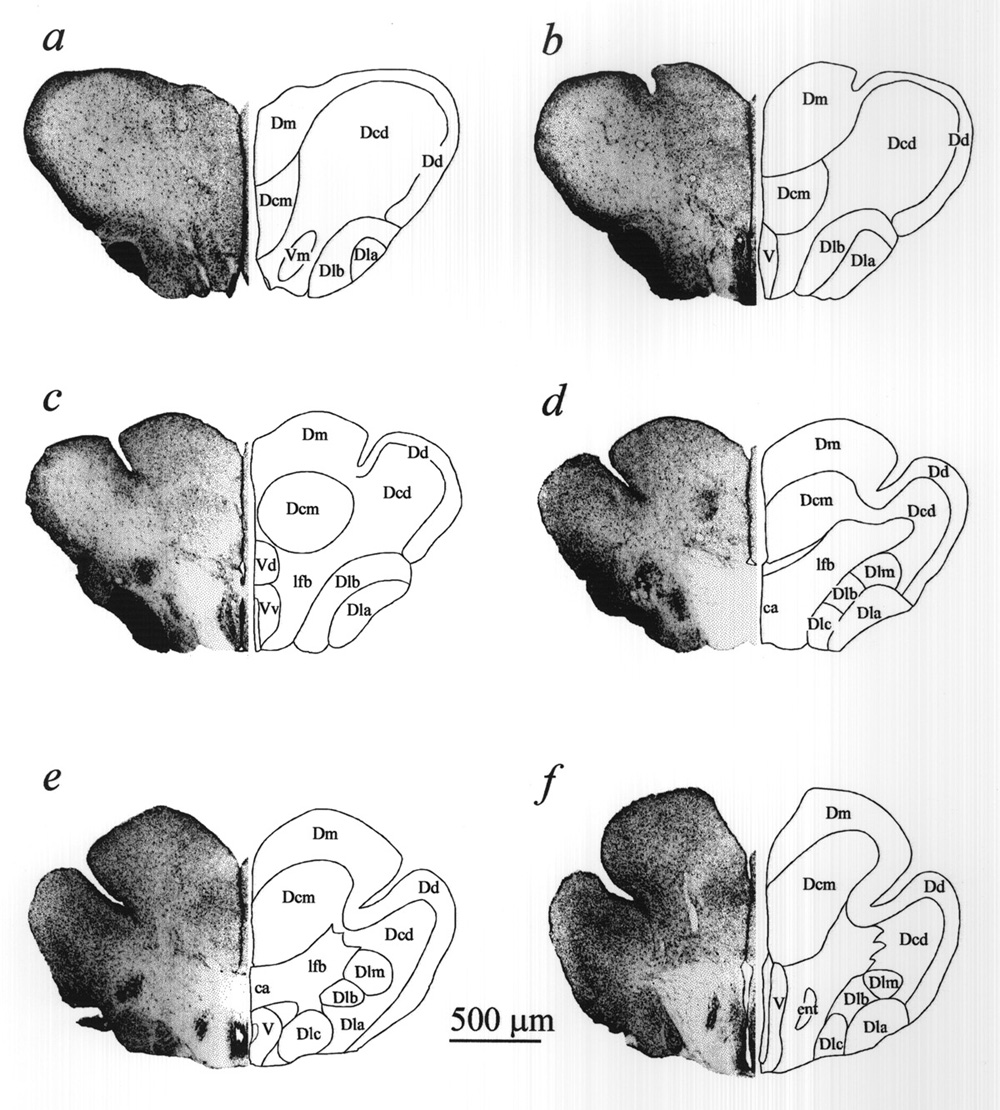 |
Figure 2 Forebrain transverse sections corresponding to planes a-f in Fig. 1B, used as templates for the reconstruction of sensory evoked response loci in Fig. 3. (30 µm sections; Cresyl violet; nomenclature adapted from Nieuwenhuys, 1963; see list of abbreviations) |
Stimuli and protocol.
In the usual protocol, at each recording locus a series of 4 different stimuli were presented, separated by >7 s intervals and the sequence was repeated at least ten times. Thus each stimulus type occurred less than once per 30 s. The first stimulus, designed for lateral line mechanoreceptors, was water displacement ~ 1 cm from the contralateral gill area by a Styrofoam shaft (6.0 x 0.7 x 0.7cm, ~ 1 cm submerged). The shaft was driven in its own axis by an audio speaker (excursion ~ 2 mm) with two cycles of a 10 Hz sine wave. This is a moderately strong but submaximal stimulus for lateral line afferents in other fish we have studied. We did not attempt to prove that this stimulus cannot excite auditory receptors of the VIIIth nerve but behavioral literature has shown auditory thresholds in many teleosts rise steeply at frequencies well above this. The second stimulus was a contralateral 100 ms light flash from a red (620 nm) light emitting diode, ca. 10 cm from the eye which was covered with a moistened tissue paper. Ambient illumination was 2-11 lux. The third stimulus was a quasi-uniform transverse electric field of 1 mV/cm at 1 cm from the lateral body surface, and 1 ms duration delivered through carbon rods located 21.5 cm from the animal on left and right sides. The fourth stimulus was a 100 ms duration, 1000 Hz tone from a speaker suspended 1 m above the tank; rise and fall times were abrupt. The intensity of the equivalent steady tone measured at the water surface was 85-90 dB SPL. This is a quite inadequate stimulus for lateral line afferents in other teleosts we have studied.
In some experiments the intensity, frequency and/or location of one or more of these stimuli were varied. Modified protocols were used to examine frequency-following responses in some modalities, by repeated interleaved presentation of 0.5, 1, 2, 3, 4, 5 and 10 Hz trains of some of the stimuli; each train was 7 s in duration and was separated from the next by an interval of 10 s.
The electric organ discharge command (EODC) was monitored as a behavioral variable and used to identify corollary discharge potentials in the brain recordings. No experiments are reported in this study in which stimuli were timed by the EODC but by chance they have occurred at all phases, with EODCs happening several times every second and thousands of stimuli at arbitrary times. Response classification. Response loci are described as unimodal if the responses recorded were repeatedly and unambiguously elicited by only one of the stimuli used. Because different stimuli were separated by >7 and up to 15 s and the same stimulus repeated once per >30 s up to a minute there was ample recovery time. Because all possible stimulus types were not implemented (e.g. tactile, proprioceptive, thermoreceptive) we can not conclude the loci to be unimodal in the strictest sense. The responses inventoried for functional mapping usually consisted of single sweep, time- locked waveforms (i.e. unaveraged evoked potentials) with superimposed multiunit activity. In some cases, however; the reproducible sounds of multiunit activity on an audiomonitor ("hash"; see below) were used as indices of responses that had smaller, less conspicuous waveforms.
|
|
Results |
|
|
|---|
Distribution of Sensory Evoked Responses
Figure 1A provides a sagittal view with the portion of valvula that was removed unilaterally in most experiments (stripes), and the approximate area that was sampled (dark shading). Figure 1B is a dorsal view of the pallium that shows the general distribution of responses mapped on transverse planes (a-f) in Fig. 3. The outlined areas are based on the combined response patterns of 18 animals. The animals were selected for having had several electrode tracks with responses to more than one stimulus type. The combined distributions, based on 251 tracks define regions (Figs.1B and 3) that are larger than would be seen in an individual but they indicate where a particular response type is likely to be obtained. Sampling in each track represented in Fig. 3a-f was at 50 µm spacings but to simplify the display only a fraction of ~7600 loci in these animals (N=18) are plotted. Sample spacing on the rostrocaudal axis varied, and is collapsed onto 6 coronal templates of a control brain whose basic divisions are illustrated in Fig. 2. The individual data sets were adjusted for brain size but because of individual differences, and nonlinear features of different brains the extrapolation of individual response loci onto a template of a standard brain incorporates some error by spatial smoothing. Thus the trends of distributions are more informative than outliers. Figure 3g shows a dorsal plan view, similar to Fig. 1B, of mapping results from four specimens. Each specimen is represented with a different symbol so that its contribution to the general pattern given in Fig. 1B can be appreciated. The color codes for stimulus modalities are the same for Figs. 3a-g. Responses to auditory stimuli were obtained reliably in every animal in the dorsal 600 µm of the rostral tip of the Dm, along the epsiliform sulcus (Figs. 1B and 3). In the same sulcal region of the Dm but more caudally and laterally, 89% of the animals showed unimodal responses to electrical stimuli. An area responsive to mechanical stimuli (water movement) is centered ~ 500-600 µm ventral and ~ 100 µm medial to the electrosensory area and was observed in all animals with deep electrode penetrations in this zone (Fig. 1B). In individual animals areas responsive to electrical or mechanical stimuli were less extensive than those responsive to auditory stimuli. Whereas, auditory responses were often observed over areas 600-900 µm across, electrical and mechanosensory response areas were generally confined to areas less than 500 µm in diameter. The responsive areas were small and their position varied between animals but tended to cluster in areas delineated in Fig. 1B.
The sample of visual responses was smaller and responsive loci were scattered and deep, 600-1700 µm below the surface (Fig. 3). The diffuse distribution of the deep visual loci is represented in Fig. 1B by stars. The apparent clustering of visual responses in the lateral pallium suggests that further sampling might have revealed visual areas in the Dcd and/or Dcm.
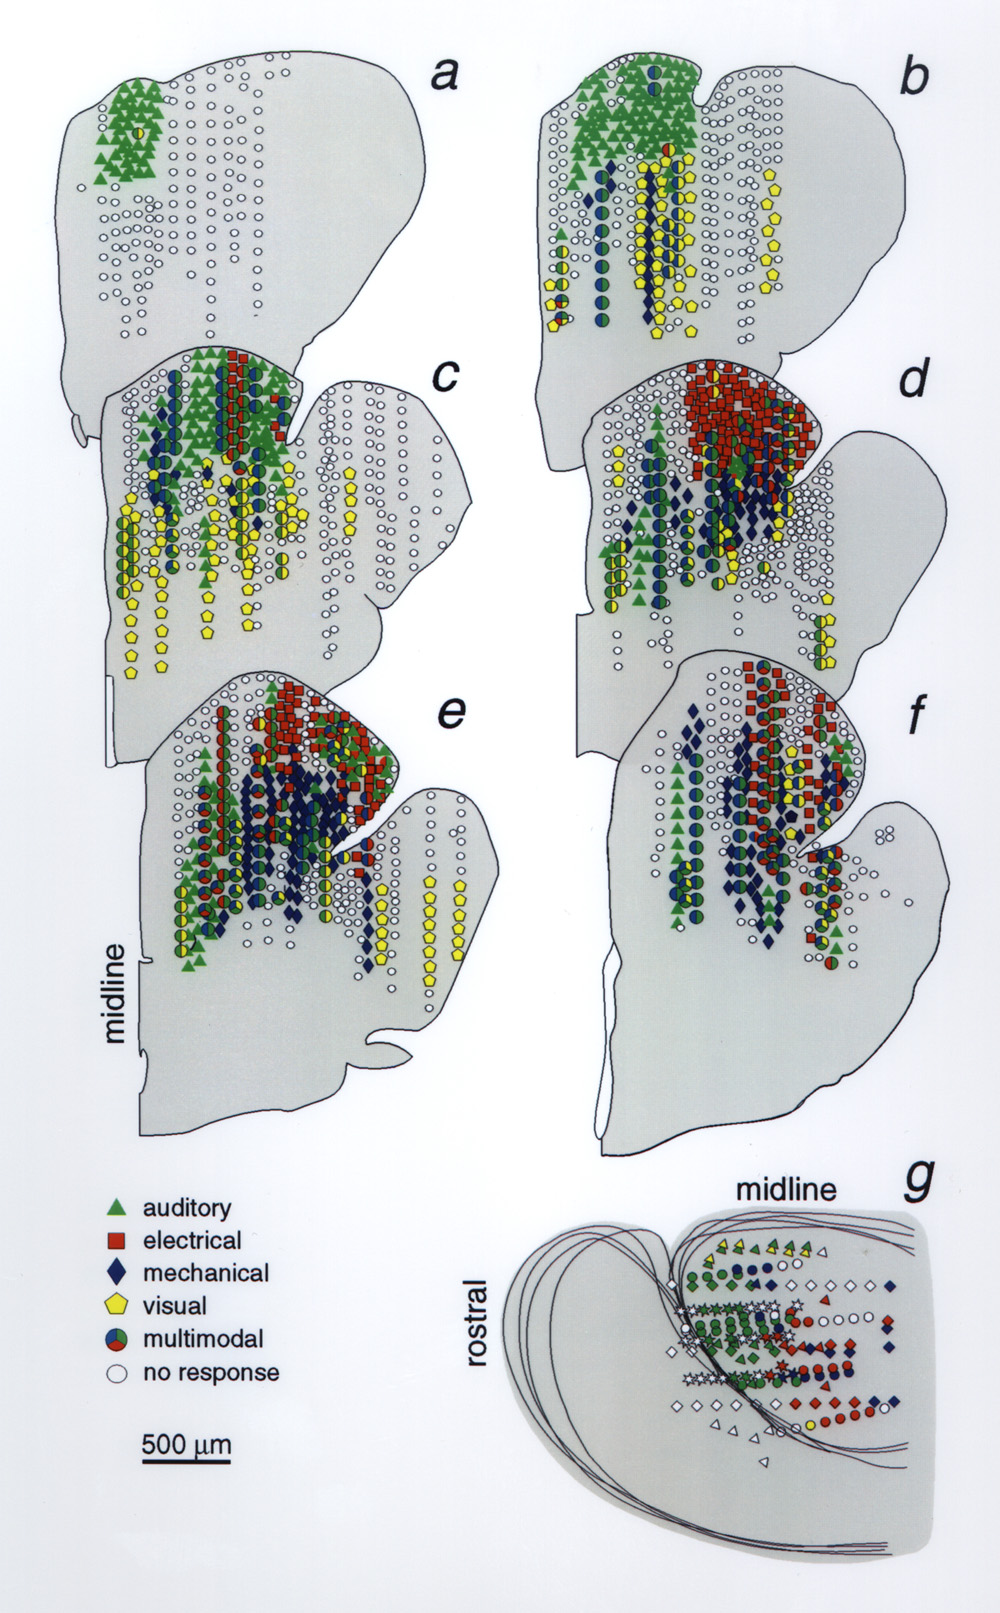 |
Figure 3 a-f, Reconstructed distribution of sensory evoked responses, superimposing data from 18 animals, projected onto six transverse planes (half sections). Sections a-f correspond to the planes of section in Figs. 1B and 2. Sampled depths in each penetration were usually 50 µm apart; here a small fraction of the loci recorded from are plotted. Responses to each stimulus type are color coded and multimodal responses are represented by larger polygons with combinations of color codes. White marks indicate a lack of response to any stimulus; their scatter among responsive loci reflects the between-animal variability in the size and location of unimodal response zones. g, Plan view of left cerebral hemisphere, as in Fig. 1B, shows the superimposed unimodal response distributions from 4 specimens represented by 4 symbols (triangle, diamond, circle, star) but with the same color code as in transverse sections. Depth of response sites is not indicated. |
Responses to Auditory Stimuli
As indicated by local field potentials or changes in multiunit activity (see Methods), auditory responses begin to rise out of background in unaveraged Dm recordings at ~ 10 ms after the onset of the stimulus. With averaging, a small positive wave peaks as early as 4 ms (P4, Fig.4B; ~ 5 µV base-to-peak); this may be a far-field auditory brainstem wave (Corwin et al. 1982). Figure 4B compares the averaged responses to 10 and 300 ms tone pips and indicates that the similar N40 waves are due to the stimulus onset rather than its duration or termination. The early, large negative wave increases in amplitude within a few hundred microns from the surface (Fig. 4A) and then declines deeper. Some changes in shape may appear during the dorsal-to-ventral penetration (Fig. 5A), however; phase- reversal of the response is not observed.
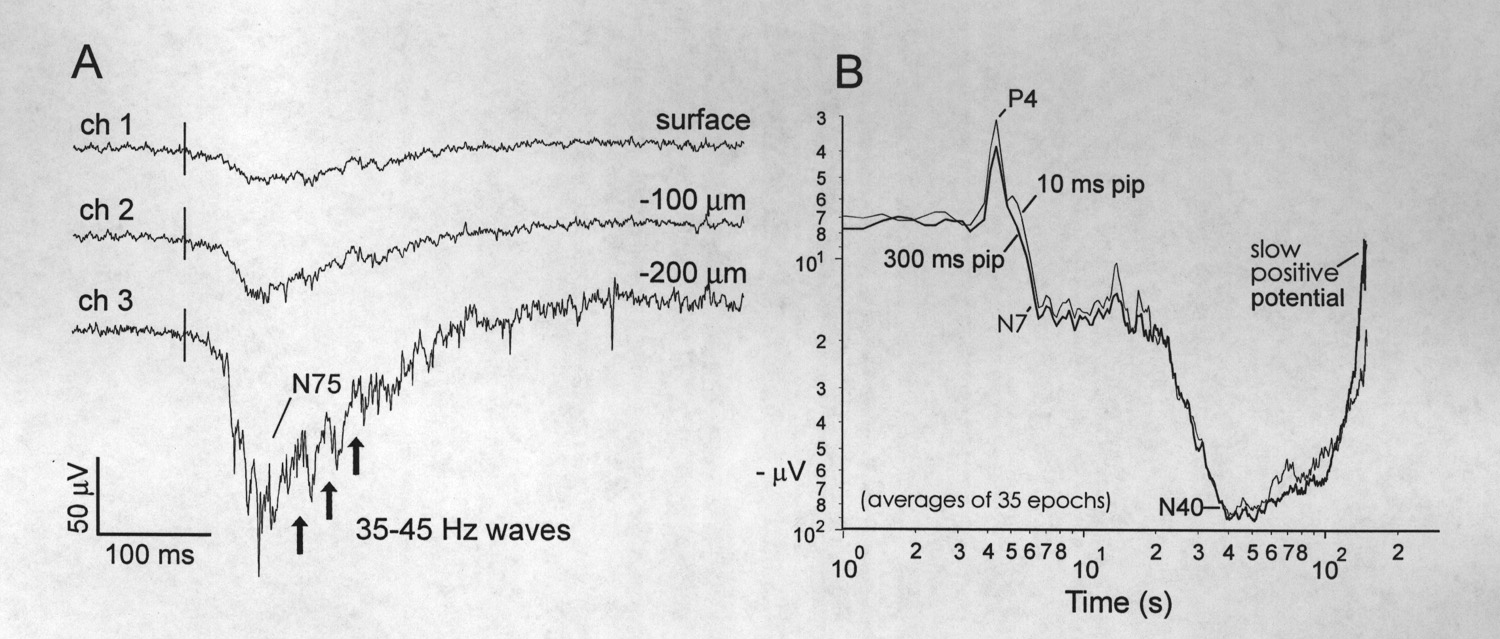 |
Figure 4 Aspects of auditory evoked response recorded in the Dm. A, Depth profile of simultaneous single sweeps of AEP recorded with a multichannel, in-line silicon probe (see Methods). Vertical lines mark the onset of the 100 ms tone pip. Arrows indicate 35-45 Hz waves that are separated by higher frequency waves and spikes. B, Averaged AEPs to 10 ms and 300 ms tone pips (thick and thin traces) recorded 100-200 µm below the surface. Traces plotted on log-log scales to emphasize early, small, far-field potentials. The baseline is arbitrarily set at 7-8 µV negative instead of the zero of the AC amplifier. The early positive wave at 4 ms (i.e. P4) has a base-to-peak amplitude of ~ 5 µV, whereas the N40 represents a negative excursion of ~ 85 µV. Plot is clipped at the beginning of a slow positive potential which lasts for hundreds of milliseconds. Note that the averaging has greatly reduced the high frequency induced waves and spikes. |
Deep responses that extended ventrally to 800 and 900 µm were shown by 69% of subjects in which there was broad sampling of the auditory area. The deeper responses have significantly shorter onset and peak latencies and their early negative waves are usually larger in amplitude (Fig. 5A). These zones were more often found in the rostral half of the auditory area. Although responses in these zones have markedly different structures at superficial and deep levels, sampling at 50 µm intervals shows a transition between responses. The star in Figure 5A at 500 µm indicates the emergence of the shorter latency response at a transitional level.
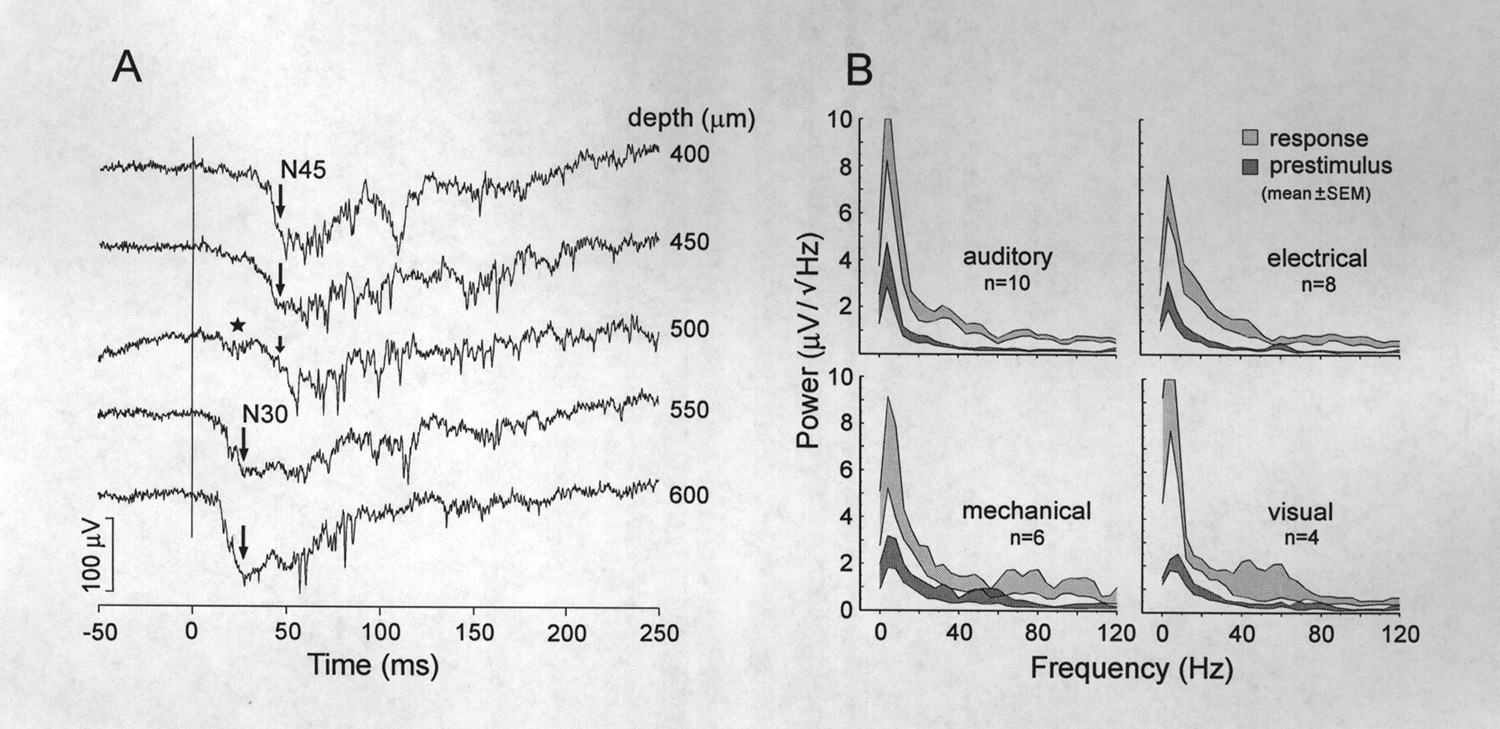 |
Figure 5 Latencies and frequency compositions of sensory evoked potentials. A, AEP depth profile illustrating a shift of principal wave (N45) to a shorter latency (N30) below 500 µm which is still an active depth, judging by local spikes. Large arrows indicate the peaks of principal waves. An intermediate form at 500 µm shows a loss of the N45 (small arrow) and emergence of the N30 (star). B, Amplitude spectra show the distribution of power in the different frequency bands before the stimulus, and during the response. Shaded areas indicate the mean ± the standard error of the mean. White areas between the shaded traces are proportional to the reliability of the power increases. Plots based on the averages of averaged responses, 10 auditory, 8 electrical, 6 mechanical, and 4 visual from different animals. |
Gamma band activity (15-55 Hz), most prominent during the 200-300 ms immediately following the large negative wave, is not "multiunit activity", which has a frequency content mostly >100 Hz. The spectrum shows an increase in power at all frequencies from 1-120 Hz but we point with interest to the gamma band activity and especially to the hump peaking at 30 Hz (Fig. 5B). Examples of this activity are given in Figs. 4A and 5A. Because the frequency is modulated during the response and the individual waves are not time locked to the stimulus, it is small or absent in the averaged response. Gamma band activity, smaller but still above baseline, usually continues during the late positive slow component for more than 450 ms after the stimulus (Table 1). The bottom trace in Figure 4A ends at 490 ms poststimulus where this band of frequencies is still elevated. Different acoustic frequencies between 500 and 2000 Hz affected the amplitude of the auditory response but usually to within 50 % of the maximum. Increasing or decreasing stimulus intensity also changed the amplitude response but little; the responses in Figs. 4-6 are of medium to near maximal amplitude (see Table 1). The response was also particularly diminished by interstimulus intervals shorter than 0.5 s; even at 1 Hz the third and later AEPs are reduced in the initial negative peak. Figure 6 shows several series of responses to trains of evenly spaced stimuli at different repetition rates to show frequency following. A prestimulus period of 10 seconds precedes the first response in each trace (only ca. 0.8 s shown). Responses to stimuli presented at 0.5 Hz show little or no decline; the smaller third response in the upper trace of Fig. 6 is atypical and not maintained with subsequent stimuli (not shown). Although responses to 1 Hz stimuli fail only slightly on the third and later stimuli, at increasingly higher rates they become small and irregular or attenuated. Averages of 4 trials (Fig. 6) reveal periods of repetitive response at 4 and 5 Hz that are particularly vulnerable and periods when frequency following is more resistant. The upper following frequency (no misses in unaveraged trials) extends only up to 3 or 4 Hz; the lowest fusion frequency (no ripple in averaged traces) was not determined but is also likely to be low. We are not aware of equivalent auditory data by other technics or on other fish but in the visual modality these numbers vary widely between species with apparent ethological significance (Bullock et al. 1991).
| Response onset (ms) | Peak latency (ms) | Duration(ms) | Amplitude(µV) | |
| Auditory (N=115) | 19 ± 3 | 58 ± 3 | 544 ± 17 | 135 ± 10 |
| Electrical (N=34) | 38 ± 2 | 68 ± 3 | 452 ± 16 | 86 ± 10 |
| Mechanical (N=41) | 36 ± 4 | 84 ± 10 | 504 ± 17 | 93 ± 10 |
| Visual (N=18) | 46 ± 4 | 136 ± 9 | 385 ± 27 | 126 ± 11 |
 |
Figure 6 Auditory frequency following response. Presentation of repetitive stimuli at different rates (1-5 Hz) shows that the amplitudes of AEPs are markedly attenuated and become labile at rates greater than 2 Hz. Even at 1 Hz, the 3rd and later AEPs are reduced in initial negativity. |
Responses to electrosensory or mechanosensory stimuli
Electrically and mechanically evoked potentials (EEPs and MEPs) were similar in shape and composition to auditory responses but in other indices more similar to each other. The average onset latencies for EEPs and MEPs were almost twice as great as for auditory responses (Table 1). This is a significant comparison if, as we believe, the several stimulus modalities were roughly equivalent in effectiveness; i.e. near-maximal. EEPs and MEPs also had significantly smaller amplitudes and shorter duration than AEPs. On these differences from auditory responses the EEP was the more extreme; their smaller amplitudes and durations are illustrated in Figure 7. EEPs and MEPs, like auditory responses showed broad-band increases in activity as compared to the prestimulus CFP (Fig. 5B). The mechanosensory stimulus, designed to excite lateral line receptors, was a local water displacement but the response did not appear to have spatial specificity because similar responses could be elicited by manually introducing other objects several centimeters away from the standard stimulus. Because the electrical stimulus was delivered through bilateral carbon rods separated by more than 40 cm it is considered to be a whole field stimulus (i.e. not a point source). Of subjects with well developed EEPs, 71 % had some electrode tracks with both EEPs and MEPs, although at different depths (Fig. 7). The degree of overlap of EEP and MEP loci shown in the experiment of Fig. 7, however, is more than usual. Except for changes in amplitude, neither the EEPs nor MEPs appeared to show systematic structural changes with depth.
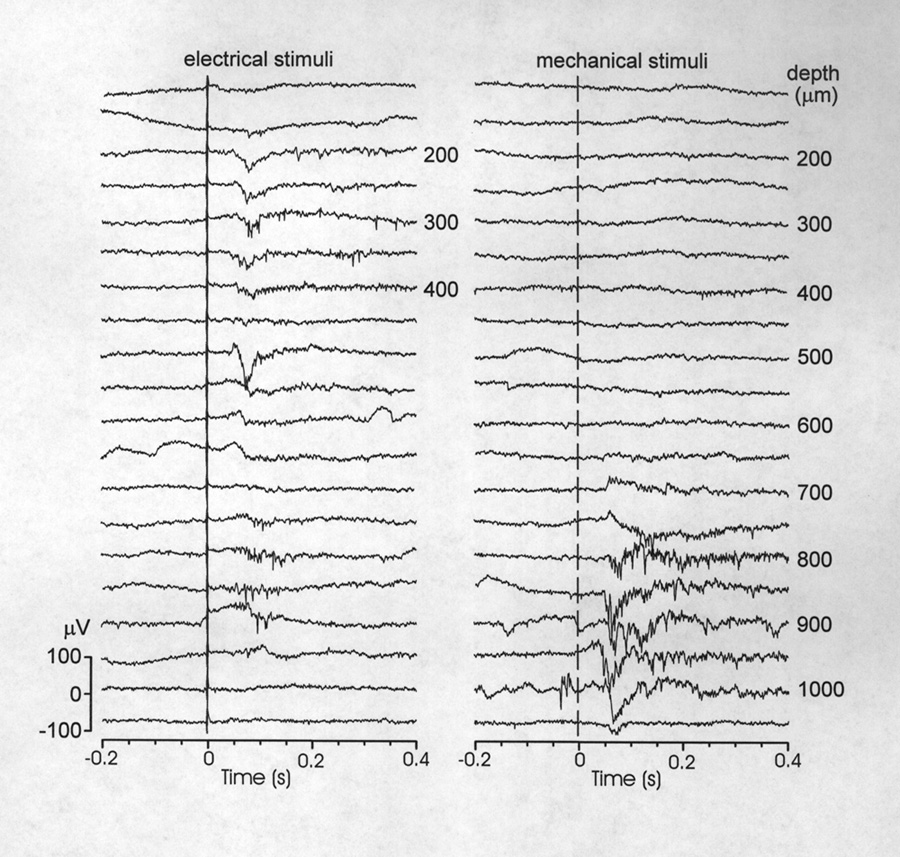 |
Figure 7 Responses to electrical and mechanical stimuli at different depths in the pallium.Responses to electrical are superficial, in the caudal half of the Dm. Response to mechanical stimuli are obtained in a similar area but always more ventrally, beginning ~ 700 µm below the surface. Note that in this sample an electrosensory response resumes in an altered form at 800-900 µm. Single sweeps; vertical line marks stimulus onset. |
Visual responses
Unlike the responses to other stimuli, visual response loci were rare in the areas most thoroughly sampled but numerous in the surveys of a few of the animals. The visual loci were most commonly found at sites > 1000 µm below the surface of the pallium. Unlike the more dorsal responses to octavolateral stimuli (i.e. auditory, electrosensory and mechanosensory), the visual responses in our sample did not seem to be concentrated in a well defined area. They most often consisted of relatively slow positive waves with superimposed high frequency (> 100 Hz) multiunit activity (Fig. 8B). Only a few loci had responses that began with negative sharp waves, marginally similar to the usual octavolateral responses.
Responses at multimodal loci
Twenty-four percent of responsive loci showed responses to two or more kinds of stimuli. These were near boundary regions of the outlined unimodal areas (Fig.1B), and also scattered through the caudal half of the pallium, mostly 330-1400 µm below the surface of the Dm. Unlike the responses to the different octavolateral stimuli, responses at multimodal loci had variable shapes that did not correlate with the particular stimulus groups. In some cases the response to one stimulus was the characteristic unimodal potential, beginning with a large negative wave, whereas the other stimulus mainly evoked changes in spiky high frequency activity (see Figs. 7 and 8). Figure 8 shows data from one of the few multimodal loci (2%) that were sensitive to all four types of stimuli - complicated by particularly large corollary discharges that accompany every EODC. Although electrosensory and mechanosensory areas were closely apposed, their combination constituted only 5% of the multimodal sites. Rather, sites responsive to auditory and electrical (16%), or auditory and mechanical stimuli (31%) were far more common.
 |
Figure 8 Example of a rare multimodal locus, recorded at successive depths where responses were observed to each of the 4 stimuli tested (panels A-D). Single sweeps all from the same animal and locus. The mechanosensory response at this locus includes a late, positive slow wave (P180). The responses to all four stimuli include long-lasting increases in multiunit activity. Note the tendency of visual and mechanical stimuli to induce bursts of corollary discharges (some marked by stars). |
Potentials related to electric organ discharge commands, singly and in sequence All fish showed a virtually continuous background of spontaneous electric organ discharge commands (EODCs) ranging from ~1 to 7 pulses per second (mean 3.4 ± 0.3; 113 responses; 18 animals). The EODC behavior also included bursts, both spontaneous and sensory-related in which the discharge frequency increased to an average maximum of 17 ± 3 pulses per second. Most of the animals persistently showed EODC bursts after 1 or 2 specific types of stimuli. Of these animals 52% showed bursts only after mechanical stimuli, 33 % only after visual stimuli, and 15% showed bursts after either visual or mechanical stimuli, or after mechanical or auditory stimuli. Electrical stimuli of the kind tested did not reproducibly induce EOD bursts. The evoked potentials (to photic, acoustic or mechanical stimuli) that accompanied EODC bursts were not noticeably different from those evoked without changes in EODC behavior.
The EODC potential recorded with the tail electrode (a stereotyped, multipeaked complex lasting ca. 5 ms) is invariably accompanied by a conspicuous slow wave at all brain loci sampled, including the medullary nucleus preeminentialis, the mesencephalic torus semicircularis and tectum and the cerebellar valvula as well as all cerebral loci examined (Figs. 8-10, stars or arrows). This slow wave we identify with the corollary discharge studied by Bell and colleagues (Bell 1981, 1986). It is biphasic, with an initially positive 20-30 ms phase followed by a negative phase lasting up to 80 ms or more and varying from insignificance to larger than the first (positive) phase which is rather consistently 60-100 µV in height. The first phase starts within 3 ms of the initial deflection of the EODC and reaches its peak ca. 10 ms after the first large spike of the EODC - much sooner than evoked potentials follow electric stimuli (Fig. 7, left). The same form and latency of slow wave is seen at all the sites just listed, both at the surface and ca. 1.5 mm deep, except that the second (negative) phase peaks much sooner (at 15-20 ms instead of 30-40 ms) in deep loci of the nucleus preeminentialis, torus and valvula. It is also much larger in the nucleus preeminentialis and torus, exceeding 400 µV peak-to-peak in the former. Seemingly electrotonically spread from a strong brainstem dipole, it is not surprising that we see no multiunit spike components in the cerebral loci, with the same electrodes that see them in the sensory evoked potential foci. Being early, large, slow, consistent and robust accompaniments of all EODCs, they appear to be independent of sensory feedback. We believe they are part of or consequences of the central signals called corollary discharges by Bell, (1981, 1986) because he regarded them as central corollaries of the motor command; we therefore refer to them as CDs. In some loci in a few animals large, broad negative potentials linked to changes in EODC frequency (henceforth delta F waves) were found in deep recordings in or near the overlap of sensory areas outlined in Figure 1B. Unlike the other sensory evoked potentials that vary in structure but occur on every trial, delta F waves appear to be facultatively triggered, or induced, because they occurred frequently after the stimulus but were entirely absent on some trials. Moreover, they sometimes occurred spontaneously, before or between stimuli. Figure 9 shows examples of delta F waves from three animals. Note that the negative and positive excursions of these waves are fairly symmetrical whereas, those evoked with the abrupt stimuli used in this study begin with a sharper negative excursion. The delta F waves are not part of a gradual increase in frequency but rather they typically appear in a long inter-EODC interval that precedes the EODC burst. Sensory induced EODC bursts, however, could also occur without these delta F waves. In one animal with a high background EODC frequency, spontaneous delta F waves correlated with brief pauses in ongoing EODC activity. Whereas, sensory evoked potentials could be linked to subsequent changes in EODC frequency they did not interact with concurrent EODCs which could occur at all phases of the sensory evoked potential (see Fig. 8).
 |
Figure 9 Samples of stimulus induced (upper trace) and spontaneous (lower traces) delta F waves from 3 animals. These large waves that begin with relatively slow negative excursions (peaking at 350 ms from the arbitrary time of the sweep start) precede bursts of EODCs and their corollary discharges (some marked by stars). The delta F wave of the upper trace occurred after an electrical stimulus whose artifact appears as a vertical line. |
Multichannel coherence analyses
Recently, the correlation of gamma band activity between brain loci has been implicated as a mechanism of integration (Bullock, 1997; Gray, 1994). To examine for evidence of temporal cooperativity between electrode channels in the responses of Gnathonemus we applied coherence analysis to simultaneously recorded responses from pairs of electrodes having a spacing of ~ 200 µm. Coherence is a number between zero and one computed for each frequency in a chosen band indicating the proportion of energy at that frequency that maintains a fixed phase (any phase) between the two sites during the analysis epoch. Using auditory responses from six animals coherence estimates were averaged for two 200 ms epochs, one just pre-stimulus and one immediately following the principal N-wave, where most of the stimulated changes in gamma activity occur. Figure 10A shows that the auditory stimulus induced a significant decrease in coherence in the 35-55 Hz band (p<0.05; 2-tailed t-test) compared to the pre-stimulus epoch. Figure 10B provides examples of 15-55 Hz filtered responses, superimposed from 3 electrodes (spaced 200- 400 µm apart). The thin arrows before the stimulus line indicate some of the waves (> 25 Hz) from the three electrodes that are congruent. The thick arrows delineate moments during the response period where the phase relationships are more variable so that coherence drops. The statistical decrease in coherence observed in the means from several animals (Fig. 10A) validate that such incongruence is typical. Recovery of the pre-stimulus high coherence is more variable and not well time-locked to the stimulus. Figure 10C gives an example of four deep loci (900-1000 µm below the surface) in one animal with visual responses that showed statistically significant, post-stimulus increases in coherence in the 52-60 Hz range. We cannot say that this is typical because there were too few suitable preparations for this type of multichannel analysis. Each trace represents the mean change in coherence for a particular pair of recording loci shown on the pallium diagram in the lower corner. The same stimuli induced a reliable decrease in coherence between loci 1 and 4 in the 12-20 Hz band. Bandpass filtered traces in panel D show the congruent gamma waves that underlie the increase in coherence. The dotted lines point to phase differences between two trials indicating that the synchronized waves are not consistently time-locked to the stimulus.
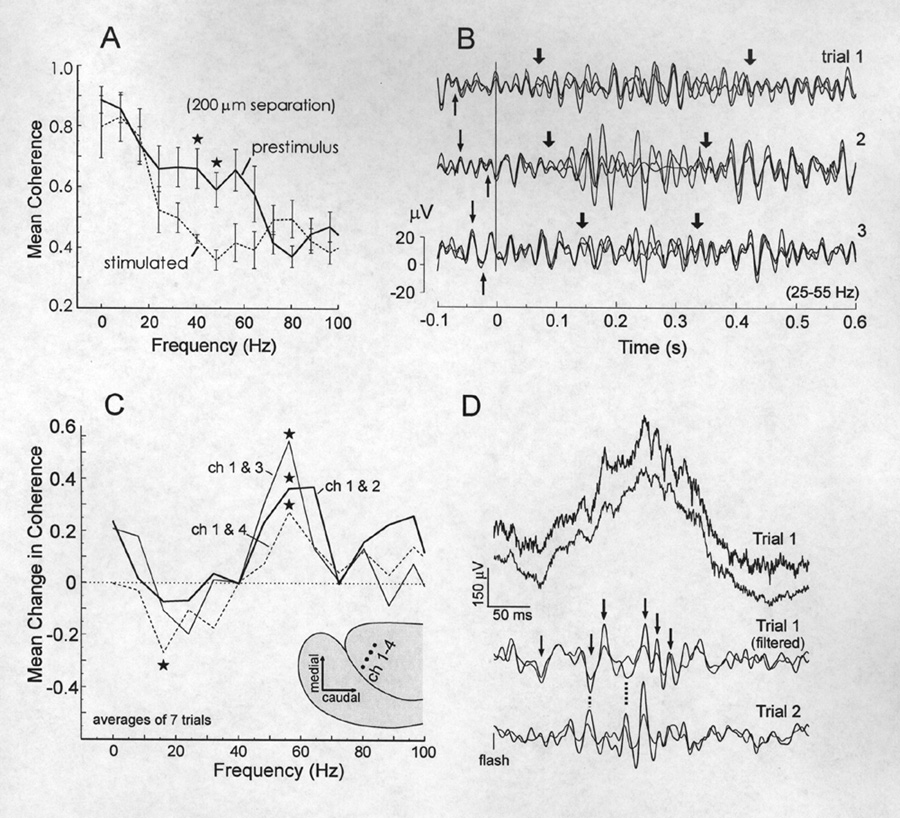 |
Figure 10 Stimulus induced changes in coherence between recording loci. A, In comparison with the immediately prestimulus baseline, coherence during the peak of the response (200ms window) between neighboring electrodes (200 µm) decreases in the ~ 35-50 Hz band andincreases in no band below 60 Hz. B, Filtered (15-55 Hz) and superimposed traces from 3 electrodes show the synchrony across the 3 loci in the ongoing LFP (thin arrows) and the phase shifts that occur during most of the response (delineated by thick arrows). C,Reproducible coherence increases in a single animal in the 52-60 Hz band after a visual stimulus. D, Superimposed traces from channels 1 and 3 in panel C before and after filtering. Arrows indicate synchronous high frequency waves in Trial 1 and dotted show the jitter of these waves between trials. (Stars in A and C represent statistical significance at the 0.05 level, two-tailed t-test) |
|
|
Discussion |
|
|
|---|
The major findings of this study are that the pallium in a teleost responds to each of four modalities of physiological sensory input in circumscribed zones and that these are mainly segregated from each other. The discrete areas for sound, water displacement and weak electric fields in this electrosensory fish lie chiefly in the pallial area dorsalis, pars medialis; vision is distributed more widely and sparsely, mainly deep in area dorsalis, pars lateralis. In addition a number of the dynamic features of the evoked responses are described. The auditory representation is the most developed - in size, reliability of response and reproducibility of area. It is subdivided into physiologically differentiated zones, possibly equivalent to the two auditory areas in the carp pallium (Echteler, 1985). Its responses have the highest voltage, shortest latencies and longest durations of the four modalities. These results are consistent with the conclusion that this mormyrid is a sound specialist (McCormick and Popper, 1984).
A remark is in order on the limitations of the data, due to our choice of four modalities, multiple electrodes, many loci in depth, many repetitions and long rest periods. We could not sample sufficiently in each individual, without excessive damage, to delineate the borders and shapes of modality-specific zones precisely. Pooling the maps from many experiments certainly blurs details; features that survive pooling are likely to be real and general. We could not vary the stimuli to find the optimum parameters in each place and fish, or equivalent valency (relative intensity) across modalities, or certain forms of subdivisions of recipient zones, although some ranges were tested without finding better parameters and all stimuli were behaviorally effective in eliciting EOD acceleration. Major questions remain for future studies such as the possibility of mapping of sensory space in each modality, and of multiple, differentiated areas in senses besides the auditory. Many trials were negative (i.e. no response to the four test stimuli), and are not shown on Fig. 3, crowded out by positive trials. With several possible causes, we cannot assign a meaning to negative trials.
Comparisons with other teleosts and other classes
Almost nothing has been known, heretofore, about the segregation or diffuseness and overlap of the projections of different sensory pathways in the pallium of fishes or amphibians. Until the development of experimental tracers little was known about the existence of such pathways, apart from the olfactory. The new methods revealed gross projections into Dm, Dl, Dd and extending into Dcd and Dcm from various diencephalic sensory areas but without clear evidence of modality segregation (Ebbesson, 1980; Northcutt and Braford, 1980; Schroeder, 1980; Northcutt, 1981; Crosby and Schnitzlein, 1982; Fiebig and Bleckmann, 1989; Wulliman and Northcutt, 1990; Bass, 1991; Striedter, 1991; Nieuwenhuys et al., 1998 - to cite a selection of reviews and a few original papers). The evoked potential method was applied by a Russian school in the '60s and led to an evolutionary scheme about visual and octavolateral segregation in the forebrain pallium of teleosts, though they expressed serious concern over the extent of electrotonic spread (Voronin et al., 1968). In elasmobranchs and teleosts, later electrophysiological studies revealed pallial responses to photic and microvolt electrical stimuli (Veselkin and Kova evi , 1969, 1973; Cohen et al., 1973; Bullock, 1979; Rakic et al., 1979; Nikonorov and Luk'yanov, 1980; Luiten, 1981; Luk'yanov and Nikonorov, 1983; Hofmann and Meyer, 1993). Finally, localized recipient zones for acoustic and lateral line mechanical input (Bodznick and Northcutt, 1984; Echteler, 1985; Bleckmann et al., 1987) were demonstrated but in separate experiments so that their overlap or discreteness could not be evaluated.
Anurans, with a more differentiated forebrain than urodeles, are poorly known but apparently much less differentiated than Gnathonemus. They send visual, acoustic and somatosensory input in parallel to the striatum and medial pallium (hippocampal homolog), the visual favoring the striatum and the somatosensory and acoustic favoring the pallium, but without as yet known segregation of modalities in these structures or any sensory input into the dorsal pallium (Nieuwenhuys et al., 1998).
Comparisons with mammalian cortical evoked potentials
The teleost telencephalon is vastly different from the mammalian, developing by inversion, lacking a laminated cortex and quite different in the tracts and connections, particularly of sensory pathways; homologies are not yet agreed upon (Northcutt, 1995; Nieuwenhuys et al., 1998). Differences between the responses in teleosts and mammals are expected and easy to list - for example the distribution of polarity with depth. It is all the more remarkable that the evoked responses obtained in Gnathonemus with simple, abrupt stimuli share key features with cortical evoked potentials of mammals. These include the large, sharp, surface negative wave that peaks within 100 ms, sometimes known as N1; its augmentation of amplitude with abruptness and intensity of stimulus and its attenuation with stimulus repetition are reasonably similar. Another is the slow, positive, late wave (200 - 400 ms) in both classes. Obviously brain size and propagation distance play a negligible role in accounting for the long latencies. Equivalent data are rare in other fish but appear to be rather similar, where comparison can be made in the studies cited two paragraphs above.
Both the mormyrid and mammals also show a class of slow wave corollary to some motor or effector behavior. In Gnathonemus we have reported a new species of this class, the "delta F" wave that facultatively accompanies shifts in EODC repetition rate such as that during active electrosensory probing (von der Emde and Zelick, 1995) - perhaps the relevant state correlate is initiation of orienting, like the wave linked to spontaneous changes in gaze and visual accommodation we discovered in turtles (Prechtl and Bullock, 1995). Others have studied (Bell, 1986) the EODC corollary discharge, a slow wave (and in the brainstem a spike burst) that promptly follows each EODC, first found in the cerebellar valvula but well known and largest in the nucleus preeminentialis of the medulla and, in our observations, also large in the torus semicircularis and somewhat smaller in the tectum of the mesencephalon, apparently quite simultaneous in all these regions. We find a slow wave of the same form and latency widespread in the cerebrum and believe it is another part or electrotonically spread sign of the same, corollary discharge system.
In the next section we single out the similarity in induced, gamma-like rhythms. The present study did not include expectation-like waves such as the omitted stimulus potential reported with visual and electrosensory stimuli in elasmobranchs and teleosts (Leuresthes, Atherinidae; Bullock et al., 1990) but we fully expect such "cognitive" waves will be found in Gnathonemus and will resemble the similarly elicited "fast" omitted stimulus wave in humans (Bullock et al. 1994).
Gamma band induced rhythms and cooperativity
The 20-55 Hz LFP component of the Gnathonemus evoked potentials can be considered analogous to gamma waves in amniote cortex and other structures (Bullock, 1992, 1997). As in most examples, the gamma waves of our fish are not phase locked to the stimulus, as are the large, early EP waves. Our hypothesis, based on the analogy with examples especially in reptiles and mammals, is that temporal patterns of such induced rhythms play some role in sensory integration. This is supported by the findings that coherence between recording sites 200-400 m apart changes significantly - typically decreasing - for certain frequency bands in the 200 ms period following the principal N- wave of auditory and visual evoked potentials in our data. This not only points to stimulus induced shifts in cooperativity but provides a control that volume conduction is not substantial in this part of the data, as it is for the corollary discharge waves. One possible cause of coherence decrease is active wave propagation, such as that shown in turtle cortex (Prechtl et al., 1997); this could not be examined under our conditions but might be detected with optical recording or high resolution arrays of electrodes in a plane. This preliminary evidence of cooperative gamma activity as well as the finding of segregated sensory areas and of spontaneous, motor-related electrical events provide further indications that the teleost pallium may mediate associative and executive functions analogous to those of the amniote telencephalon. At the same time these features are compatible with some quite divergent physiology, organization and role. It remains for deeper insights, based on new evidence, to reveal the proper perspective on the teleost pallium.
|
|
References |
|
|
|---|
Bass AH (1991) Organization of the telencephalon in the channel catfish, Ictalurus punctatus. J Morphol 169:71-90.
Bastian J (1994) Electrosensory organisms. Phys Today 47: 30-37
Bell CC (1981) An efference copy that is modified by reafferent input. Science 214:450- 453. Bell CC (1986) Electroreception in mormyrid fish. Central physiology. In Electroreception (Bullock TH, Heiligenberg W, eds), pp 423-452. New York: Wiley.
Bleckmann H, Bullock TH, J rgensen JM (1987) The lateral line mechanoreceptive mesencephalic, diencephalic, and telencephalic regions in the thornback ray, Platyrhinoidis triseriata (Elasmobranchii). J Comp Physiol A 161:67-84.
Bodznick D, Northcutt RG (1984) An electrosensory area in the telencephalon of the little skate, Raja erinacea. Brain Res 298:117-124.
Bullock TH (1979) Processing of ampullary input in the brain: comparison of sensitivity and evoked responses among elasmobranchs and siluriform fishes. J Physiol, Paris 75:397-467.
Bullock TH (1992) Introduction to induced rhythms: a widespread, heterogeneous class of oscillations. In Induced Rhythms in the Brain (Ba ar E, Bullock TH, eds), pp. 1-26. Boston: Birkhäuser.
Bullock TH, Hofmann MH, Nahm FK, New JG, Prechtl JC (1990) Event-related potentials in the retina and optic tectum of fish. J Neurophysiol 64:903-914.
Bullock TH, Hofmann MH, New JG, Nahm FK (1991) Dynamic properties of visual evoked potentials in the tectum of cartilaginous and bony fishes, with neuroethological implications. J Exp Zool Suppl 5:142-155.
Bullock TH, Karamürsel S, Achimowicz JZ, McClune MC, Basar-Eroglu C (1994) Dynamic properties of human visual evoked and omitted stimulus potentials. Electroencephalogr Clin Neurophysiol 91:42-53.
Bullock TH (1997) Signals and signs in the nervous system: the dynamic anatomy of electrical activity is probably information-rich. Proc Natl Acad Sci U S A 94:1-6.
Butler AB, Hodos W (1996) Comparative Vertebrate Neuroanatomy. New York: Wiley- Liss.
Cialo S, Gordon J, Moller P (1997) Spectral sensitivity of the weakly discharging electric fish Gnathonemus petersii using its electric organ discharges as the response measure. J. Fish Biol. 50:1074.
Cohen DH, Duff TA, Ebbesson SOE (1973) Electrophysiological identification of a visual area in shark telencephalon. Science 182:492-494. Corwin JT, Bullock TH, Schweitzer J (1982) Auditory brainstem response in five vertebrate classes. Electroencephalogr Clin Neurophysiol 54:629-641.
Crosby EC, Schnitzlein HN (1982) Comparative Correlative Neuroanatomy of the Vertebrate Telencephalon. New York: Macmillan.
Davis RE, Kassel J (1983) Behavioral functions of the teleostean telencephalon. In: Fish neurobiology. (Northcutt RG, Davis RE, eds) Ann Arbor: University of Michigan Press.
De Bruin JPC (1980) Telencephalon and behavior in teleost fish: a neuroethological approach. In: Comparative Neurology of the Telencephalon (Ebbesson SOE, ed) New York: Plenum.
Ebbesson SOE (1980) A visual thalamo-telencephalic pathway in a teleost fish (Holocentrus rufus) Cell Tissue Res 213:505-508.
Echteler SM (1985) Organization of central auditory pathways in a teleost fish, Cyprinus carpio. J Comp Physiol A 156:267-280.
Fiebig E, Bleckmann H (1988) Telencephalic afferents in the thornback guitarfish, Platyrhinoidis triseriata (Elasmobranchii). A WGA-HRP study. In: Proceedings of the 16th Göttingen Neurobiology Conference (Elsner N, Barth FG, eds), pp 304. Stuttgart: Thieme.
Finger TE (1980) Nonolfactory sensory pathway to the telencephalon in a teleost fish. Science 210:671-673.
Gray CM (1994) Synchronous oscillations in neuronal systems: mechanisms and functions. J Compute Neurosci 1:11-38.
Hofmann MH, Meyer DL (1993) Visual-evoked responses in the salmon telencephalon change during smolt transformation. Neurosci Lett 155:234-236.
Hopkins CD (1988) Neuroethology of electric communication. Ann Rev Neurosci 11:497- 535.
Ito H, Kishida R (1978) Telencephalic afferent neurons identified by the retrograde HRP method in the carp telencephalon. Brain Res 149:211-215.
Laming PR, McKee M (1981) Deficits in habituation of cardiac arousal responses incurred by telencephalic ablation in goldfish, Carrasius auratus, and their relation to other telencephalic functions. J Comp Physiol Psychol 95: 460-467.
Luiten PGM (1981) Two visual pathways to the telencephalon in the nurse shark (Ginglymostoma cirratum). II. Ascending thalamo-telencephalic connections. J Comp Neurol 196:539-548.
Luk'yanov AS, Nikonorov SI (1983) Bilateral representation of visual afferentation in the forebrain pallium of the dogfish shark Squalus acanthias. Zh Evol Biokhim Fiziol 19:486-492 (in Russian).
McCormick CA, Popper AN (1984) Auditory sensitivity and psychophysical tuning curves in the elephant nose fish, Gnathonemus petersii. J Comp Physiol 155A:753-761.
Moller P (1995) Electric fishes history and behavior. London: Chapman and Hall.
Nieuwenhuys R (1963) The comparative anatomy of the actinopterygian forebrain. J Hirnforschung 6:171-200.
Nieuwenhuys R, Ten Donkelaar HJ, Nicholson C (1998) The Central Nervous System of Vertebrates. Berlin: Springer Verlag.
Nikonorov SI, Luk'yanov AS (1980) Electrophysiological investigations of afferent visual projections to the forebrain in the dogfish Squalus acanthias. Zh Evol Biokhim Fiziol 16:167-175 (in Russian).
Northcutt RG (1981): Evolution of the telencephalon in nonmammals. Ann Rev Neurosci 4:301-350.
Northcutt RG (1995) The forebrain of gnathostomes In search of a morphotype. Brain Behav Evol 46:275-318.
Northcutt RG, Braford MR, Jr. (1980) New observations on the organization and evolution of he telencephalon of actinopterygian fishes. In: Comparative Neurology of the Telencephalon (Ebbesson SOE, ed), pp 41-98. New York: Plenum.
Prechtl JC, Bullock TH (1995) Structure and propagation of cortical oscillations linked to visual behaviors in the turtle. 2nd Joint Symposium on Neural Computation Proceedings, UC San Diego & California Institute of Technology, 5:105- 114.
Prechtl JC, Kleinfeld D (1997) Intracellular correlates of visually induced coherent activity in turtle visual cortex. Soc Neurosci Abst 23:1451.
Prechtl JC, Cohen LB, Pesaran B, Mitra PP, Kleinfeld D (1997) Visual stimuli induce waves of electrical activity in turtle cortex. Proc Natl Acad Sci USA 94:7621-7626.
Rakic L, Belekhova MG, Konevic D (1979) Visual projections in the telencephalon and diencephalon of the teleost Serranus scriba. Zh Evol Biokhim Fiziol 15:357-367 (in Russian).
Rigley L, Marshall J (1973) Sound production by the elephant nose fish, Gnathonemus petersii (Pisces Mormyridae) Copeia 134-135.
Schroeder DM (1980) The Telencephalon of Teleosts. In: Comparative Neurology of the Telencephalon (Ebbesson SOE, ed), pp 99-115. New York: Plenum.
Segaar J (1961) Telencephalon and behavior in Gasterosteus aculeatus. Behavior 28:256- 287.
Striedter GF (1991) Auditory, electrosensory, and mechanosensory lateral line pathways through the forebrain in channel catfishes. J Comp Neurol 312:311-331.
Veselkin NP, Kova evi N (1969) Visual projections in the telencephalon and cerebellum of teleost fishes. Zh Evol Biokhim Fiziol 5:416-418 (in Russian).
Veselkin NP, Kova evi (1973) Non-olfactory telencephalic afferent projections in elasmobranch fishes. Zh Evol Biokhim Fiziol 6:585-592 (in Russian).
von der Emde G (1990) Discrimination of objects through electrolocation in the weakly electric fish, Gnathonemus petersii. J Comp Physiol A 167:413-421.
von der Emde G (1998) Electroreception. In: Evans, D. H. (ed.) The Physiology of fishes, CRC Press, Boca Raton, Florida, (in press)
von der Emde G, Bleckmann H (1998) Finding food: senses used during foraging of insect larvae in the electric fish, Gnathonemus petersii. J Exp Biol (in press)
von der Emde G, Zelick R (1995) Behavioral detection of electrical signal waveform distortion in the weakly electric fish, Gnathonemus petersii. J Comp Physiol 177:493- 501.
Voronin LG, Gusselnikova KG, Gusselnikov VI, Supin AJ (1968) On the problem of the evolution of the vertebrate afferent systems. Progr Brain Res 22:541-565.
Wullimann MF, Northcutt RG (1990) Visual and electrosensory circuits of the diencephalon in mormyrids: an evolutionary perspective. J Comp Neurol 297:537-552.
|
|
Abbreviations |
|
|
|---|
AEP auditory evoked potential caanterior commissure
CFP compound field potential
Dc telencephalic area dorsalis pars centralis
Dcd Dd associated part of the Dc
Dcm Dm associated part of the Dc
Dd telencephalic area dorsalis pars dorsalis
Dl telencephalic area dorsalis pars lateralis
Dla telencephalic area dorsalis pars lateralis, part a
Dlb telencephalic area dorsalis pars lateralis, part b
Dlc telencephalic area dorsalis pars lateralis, part c
Dlm telencephalic area dorsalis pars lateralis, medialis
Dm telencephalic area dorsalis pars medialis
EEP electrosensory evoked potential
ent nucleus entopeduncularis
EOD electric organ discharge
EODC electric organ discharge command signal, recorded at the tail, presumably a junctional potential of the curarized EOD
LC caudal lobe
lfb lateral forebrain bundle
LFP local field potential
LP posterior lateral line lobe
MEP mechanosensory evoked potential
TH thalamus
V telencephalic area ventralis
Vd telencephalic area ventralis pars dorsalis
Vm telencephalic area ventralis pars medialis
Vv telencephalic area ventralis pars ventralis